MNK at one point was up 200% from yday lows that’s volatility, also reported earnings had some settlement news, and now it’s above the 200day above this 5.60 area that’s the flag breakout, I will buy some if it takes out orhs. They’re selling off all these gappers, that’s not a good sign, not a good sign at all for the markets. If it reclaims vwap and takes out intraday highs later in the day could be interesting, volume is prob gonna be the highest ever.
COCP yday from orhs would have been epic this 80c area, Jesus nearing a 3x from that, I was looking at it as it broke out. Volume on this thing just incredible already bigger than yday. COCP had a stuff candle here, but if it starts breaking above this 2.39 later in the day could be interesting, as long as the hls are intact. COCP starting to look a bit vulnerable here, below vwap, if it loses this 218 area maybe could flush back to mid 1s today, it’s too low priced I don’t like trading low priced stocks like this, I’d prefer it went to like $4/5.
TSLA it’s resting on this rising hourly 65ema, if it can break will be the first time since early Dec, this thing has been going up 150% since last time it was below, now resting just on it if it can break I think potential pullback coming. TSLA did tiny starter will add more if it goes red, on the 60min has this range here hls and got rejected off these declining emas so far. TSLA added a few more shares, and if it can go sideways here build a tighter range on the 60min then break lower I will add more, but don’t wanna go crazy here since TSLA has been showing some rs. TSLA damn I don’t have enough, I’ll cover some tiny.
CODX, I was super lucky on it, I had three lots of 20k shares buy orders set, 3.28, 3.31 & 3.38, they released some kinda corona related pr and this thing just went straight up and I got filled 60k shares 3.35 avg. Really happy about it. I missed the sells here at the top but sold some in the low 4s. I’ve been talking about this thing a lot, first level to break was 3.30s, then the 3.50 area. I think it could double go to $6/7 look at this triangle it’s been building the past month or so, higher lows all the way.
TVIX did some small here orhs, in case the market starts selling off from this little bounce we had, looking for some kinda pullback. TVIX gonna sell some here sell down a little bit, going straight up, this is what I was afraid of the gap up and crap, I wouldn’t be surprised if we pull back to the rising 200 day on the major indices, this has been support for the past two dips, back in may&oct2019, that also happens to be the area where the market broke out, so that’s like a double support there. I think we have entered into a choppy market, I don’t think breakouts will work the next few months, even if we don’t pull back more, I think we chop around. The ideal scenario is if we get a violent pullback to the rising 200 day, or even undercut it, get it over with quick. It’s impossible to predict what the markets will do, but it’s good to have some potential scenarios in mind. TVIX gonna add a few thousand gonna anticipate hod break. This thing could easily go up 100%+, if you look at any past correction, back in Sep/Oct2018 it was up 130%, then another 100% in Dec. In early 2018 this was up 180% in a few days, Aug2015 was up over 200%. Added a few more not gonna go crazy on it 1700shares. Ah when TVIX goes to 80 I’m gonna wish I added even more. Okay I added a bit more. TVIX has the most volatility of all these volatility products, I’m using this because I don’t have to use as much bp to get the most bang for your buck.
ETH names pulling back, ETCG and ETHE, ETHUSD resting right at the 20day, if it starts breaking below that I would size down both.
No I’m not using RSI or MACD, I don’t think there’s any value in those. MACD is based on MAs and RSI is based on price. I already have those on my charts. I don’t need an indicator to tell me something I already see. The less you use the better, price really is most important. I use MAs bc they work really well on trending stocks. Everything else is noise. MAs are also based on price, but I think they give a nice visual representation. It’s hard for my mind to just visualise these moving averages in my head. And RSI, on the downside yeah it can be useful, but on the upside, the best stocks are overbought. It has no value when things go up.
I’m gonna move the stops on everything to lods. I’m gonna size down pretty big. Sell heavily heavily heavily on what I have left. This is not the time to be aggressive on the long side, these things can pull back a lot.
We are overdue for a correction, the past few weeks we’ve seen some historical overbought readings in the indices. I wouldn’t be surprised if we pulled back to this rising 200day, that would just be normal price action, corona or not.
I’m just trying to follow price action, when the market is going higher I try to buy strong stocks, when it goes lower I keep the strongest ones and I sell the weakest ones. I keep the flowers and I pull out the weeds.
I don’t know if I talked about it yesterday, but making a comparison to Ebola craze back in 2014. The market pulled back Sep/Oct, Nasdaq 10% in a month or so, bottomed 15th Oct, bounced and went up. APT, same time as markets went lower, had a 300% run, and it peaked a day before market bottomed, same thing with LAKE. So these corona stocks could do the same thing now.

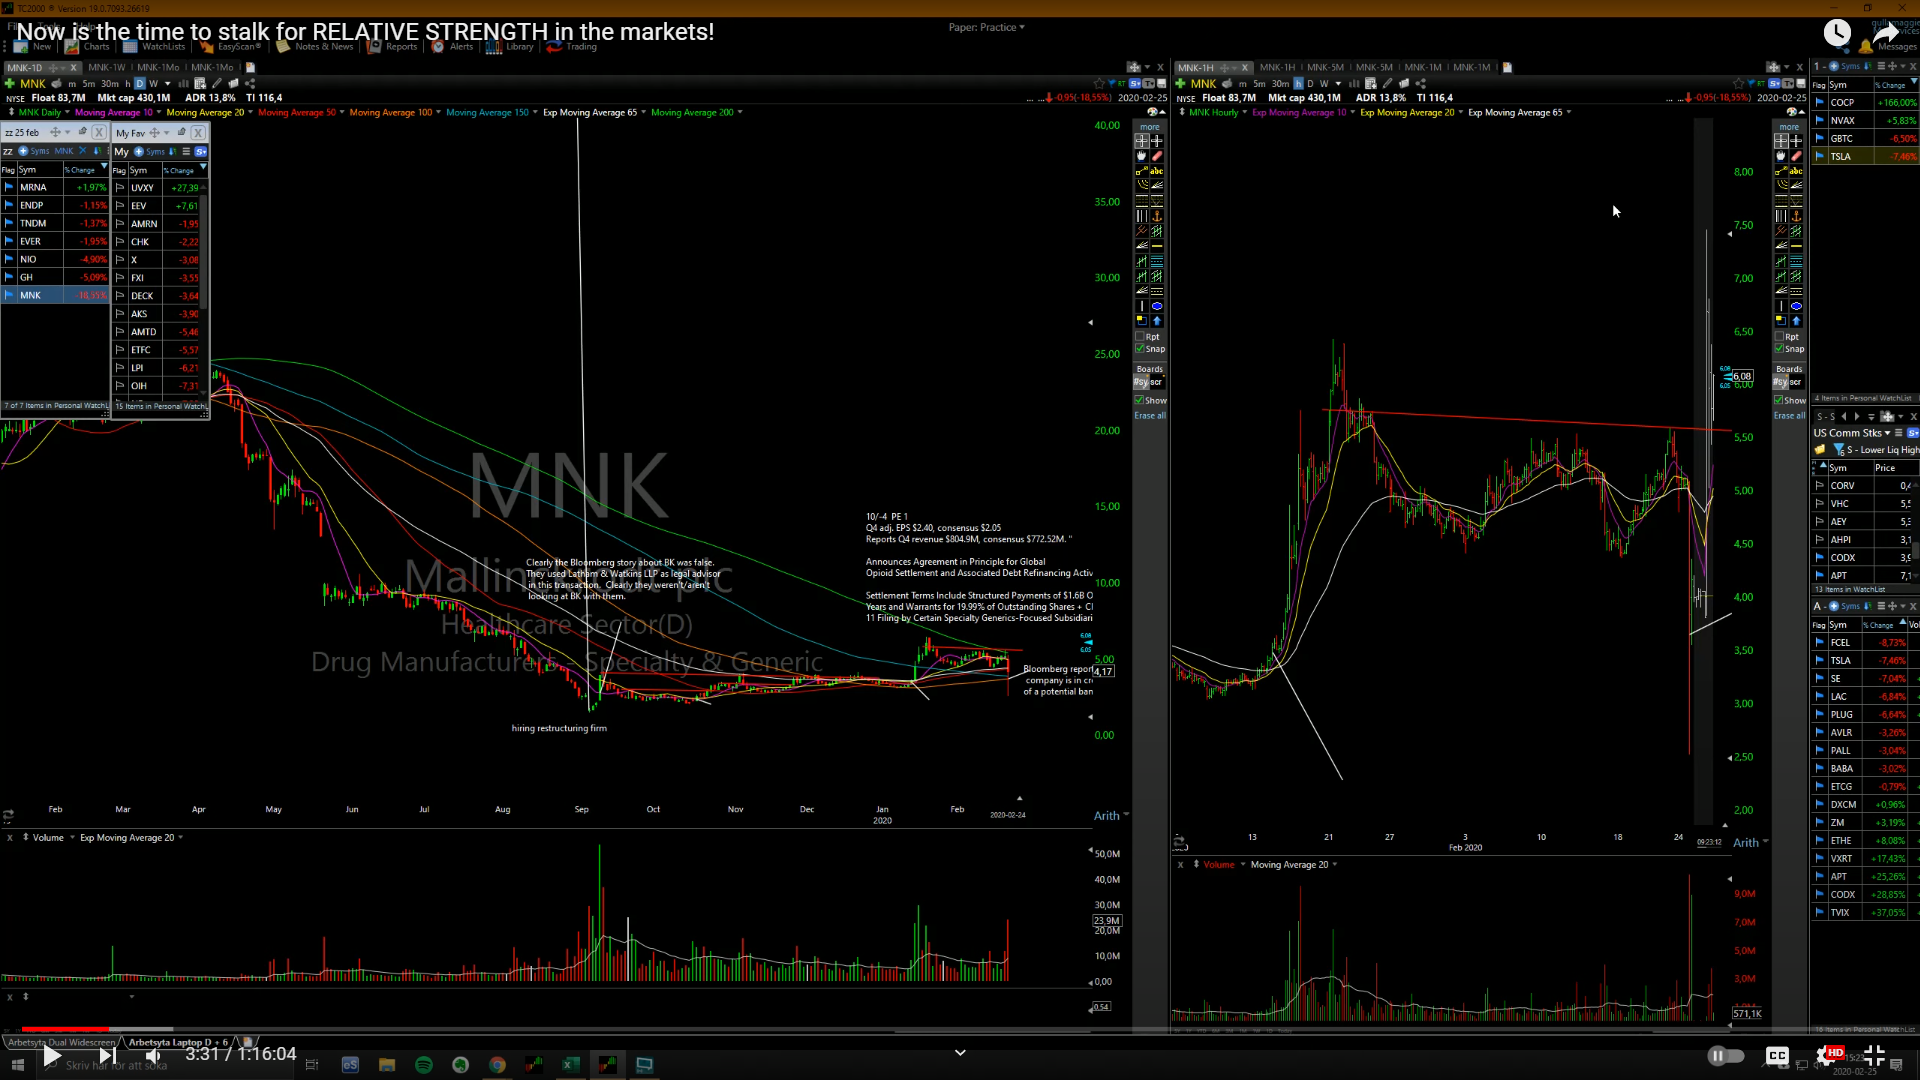 They’re selling off all these gappers, that’s not a good sign, not a good sign at all for the markets. If it reclaims vwap and takes out intraday highs later in the day could be interesting, volume is prob gonna be the highest ever.
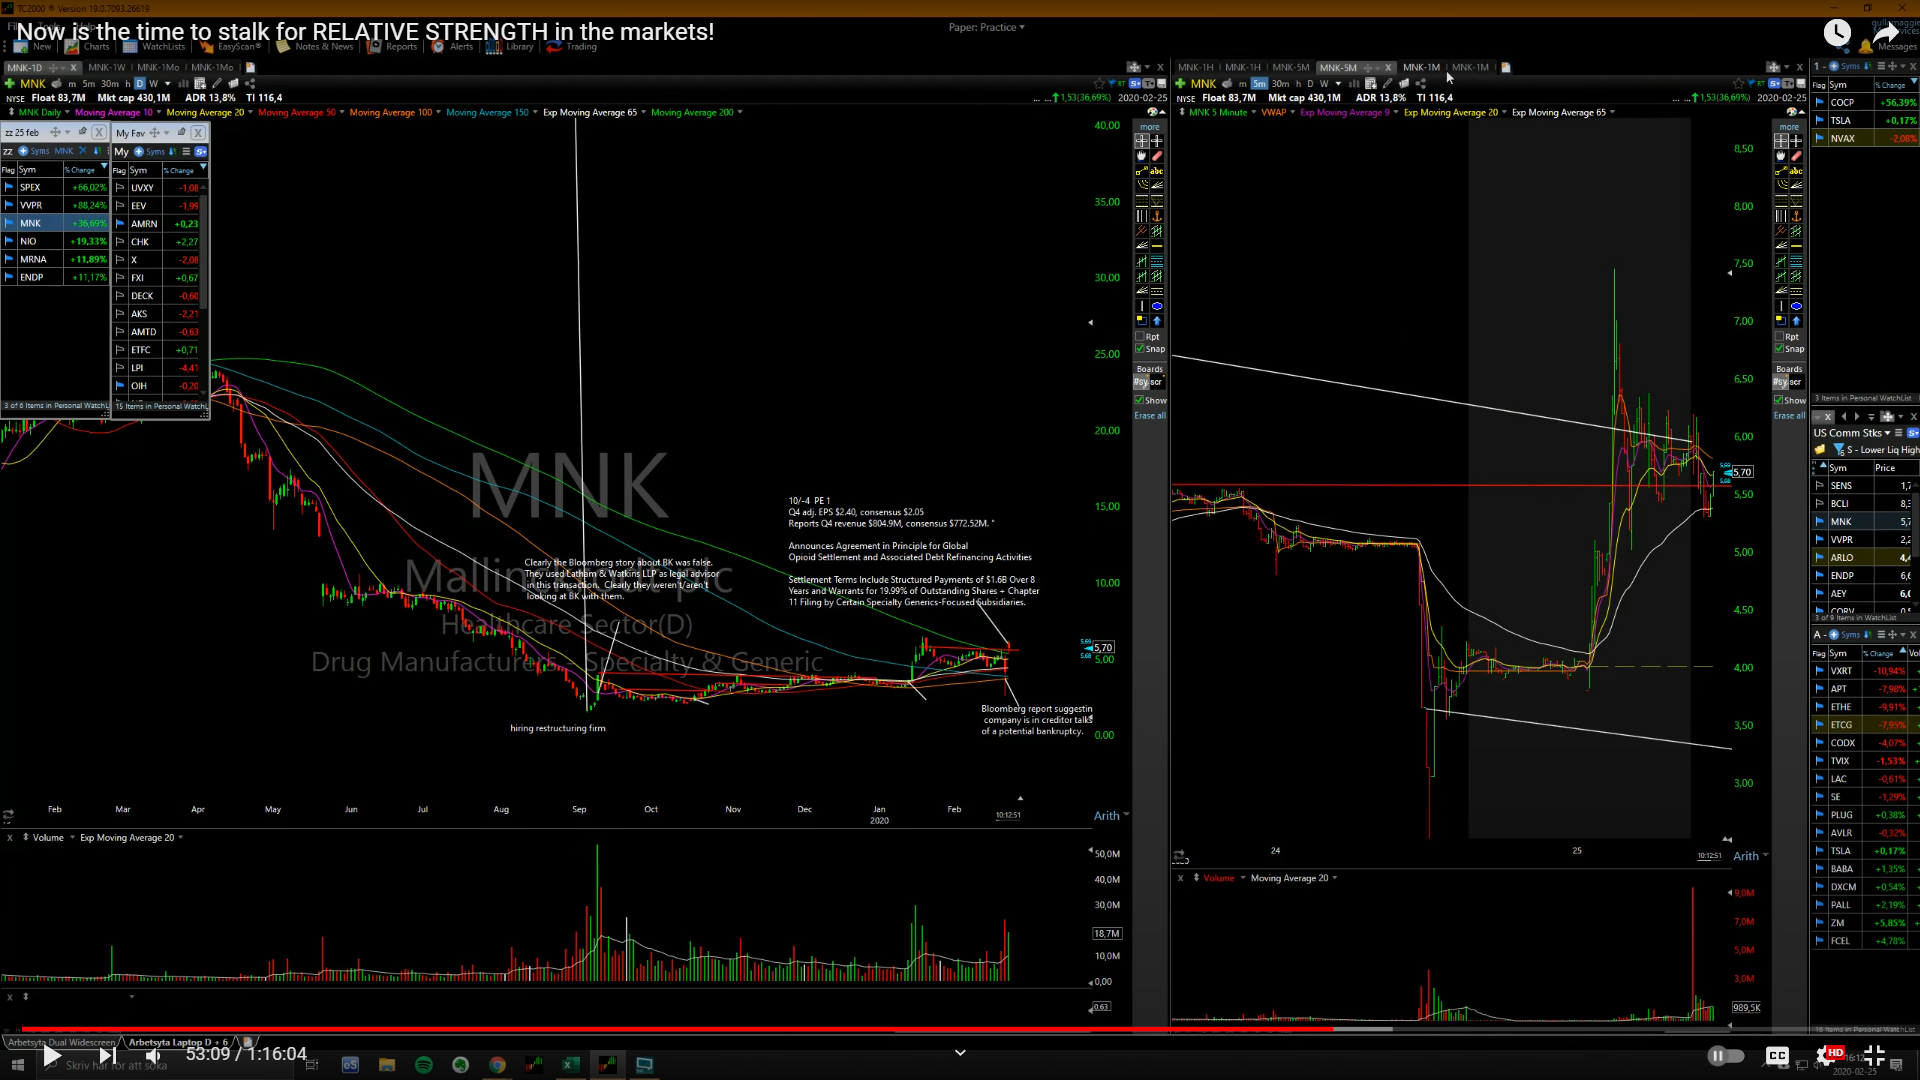
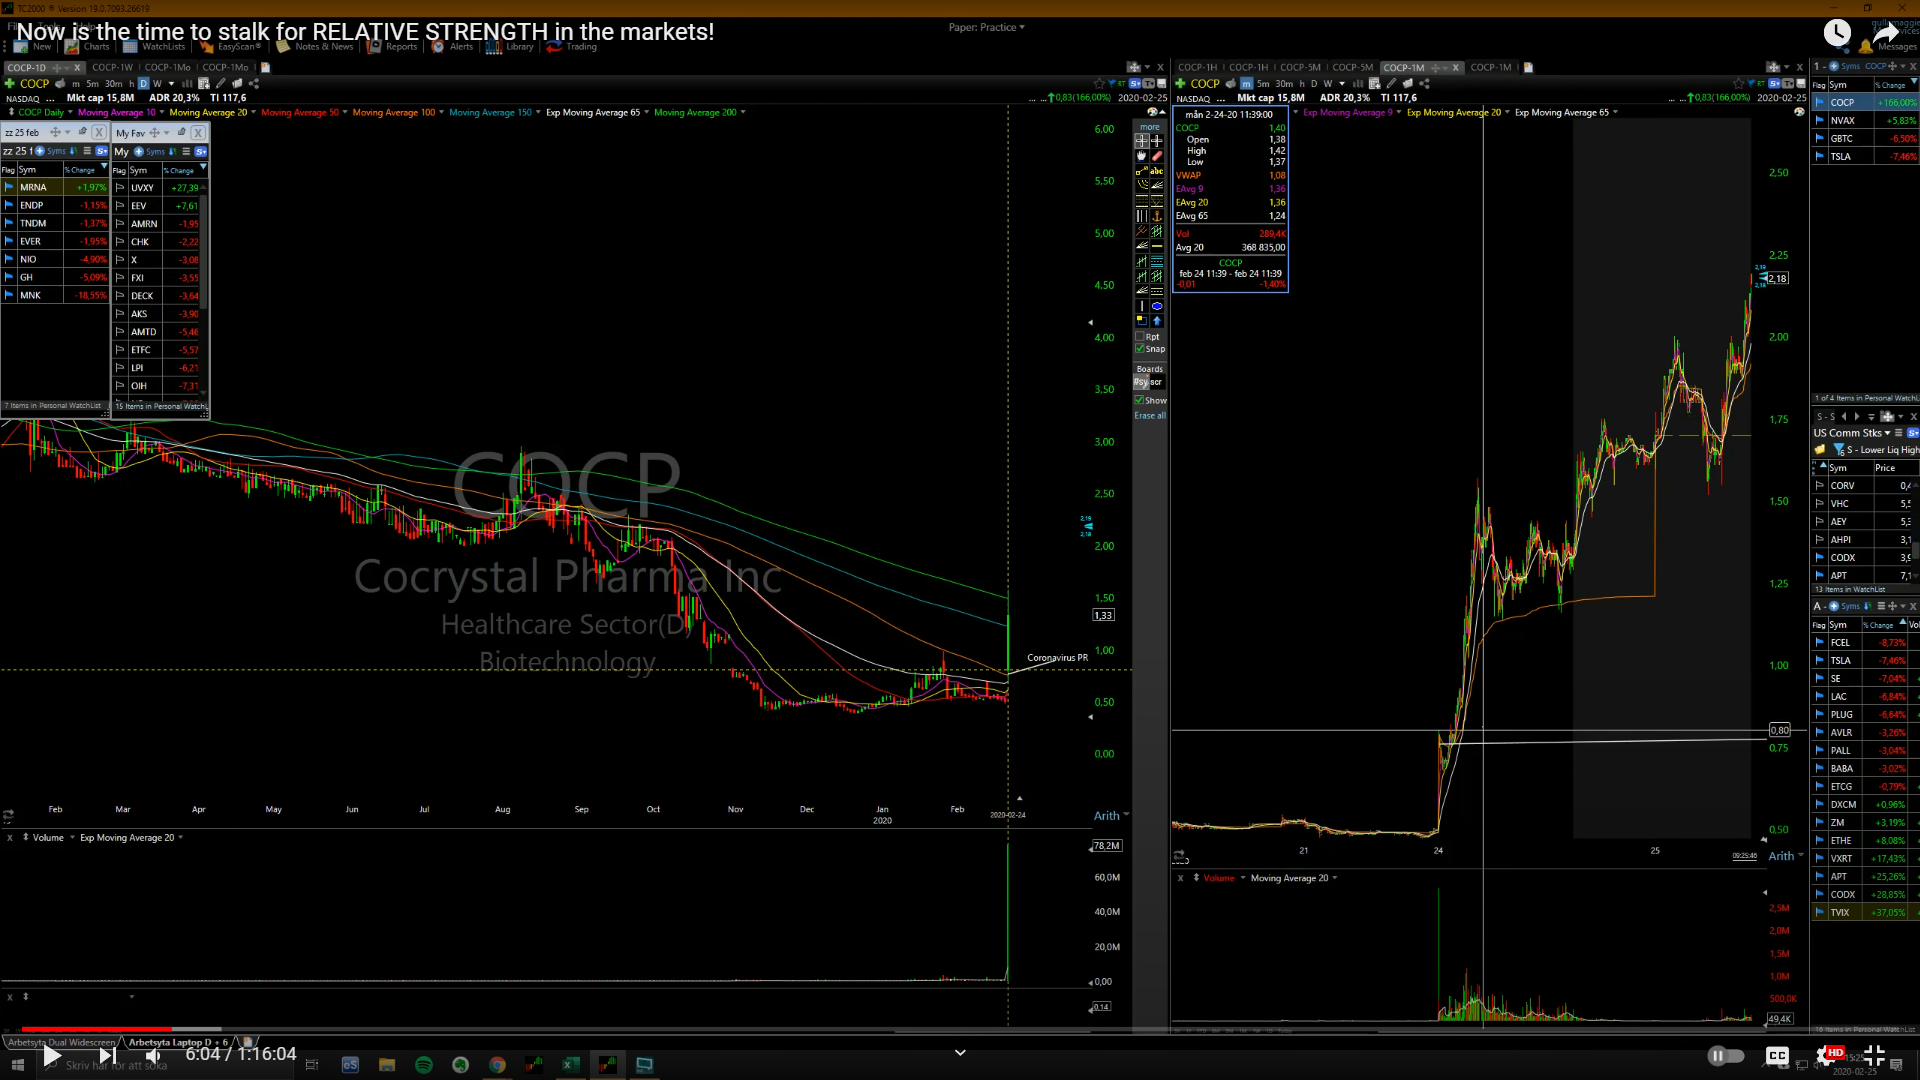 Volume on this thing just incredible already bigger than yday. COCP had a stuff candle here, but if it starts breaking above this 2.39 later in the day could be interesting, as long as the hls are intact.
 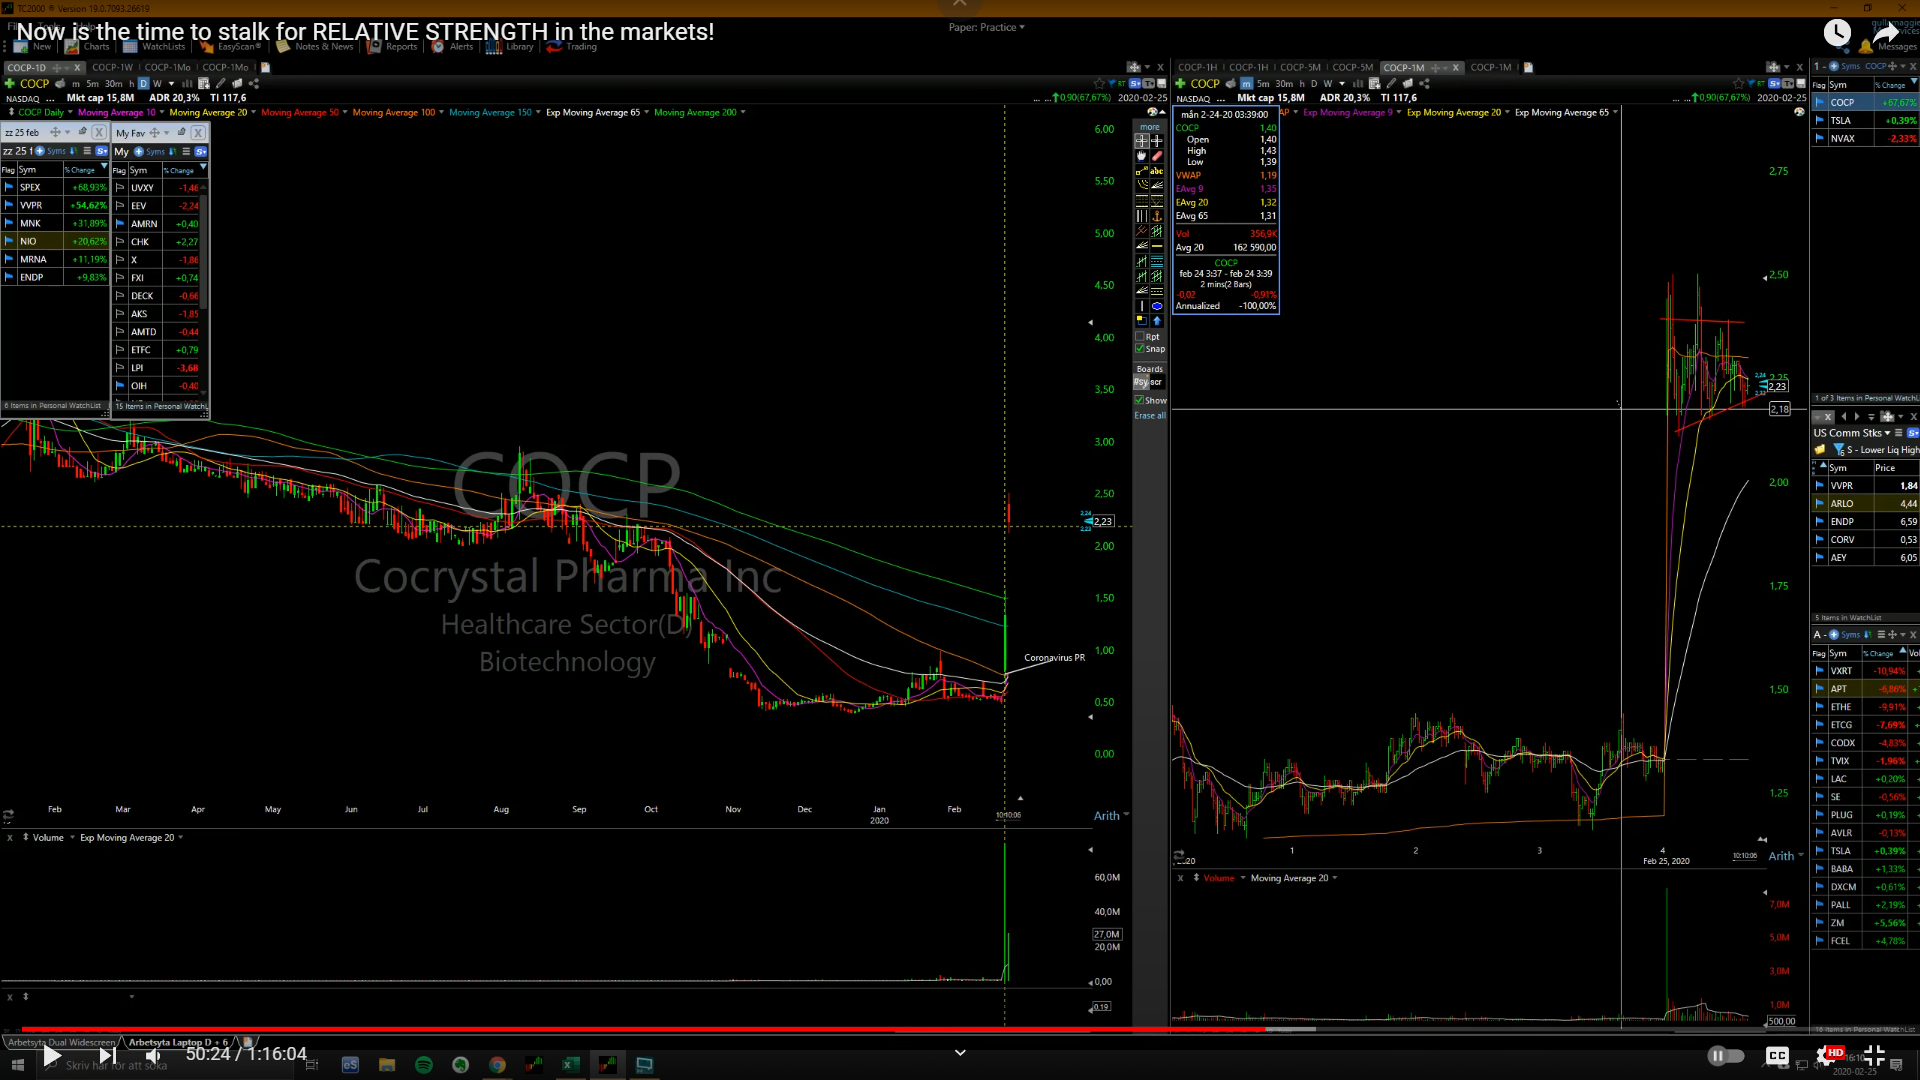 COCP starting to look a bit vulnerable here, below vwap, if it loses this 218 area maybe could flush back to mid 1s today, it’s too low priced I don’t like trading low priced stocks like this, I’d prefer it went to like $4/5.
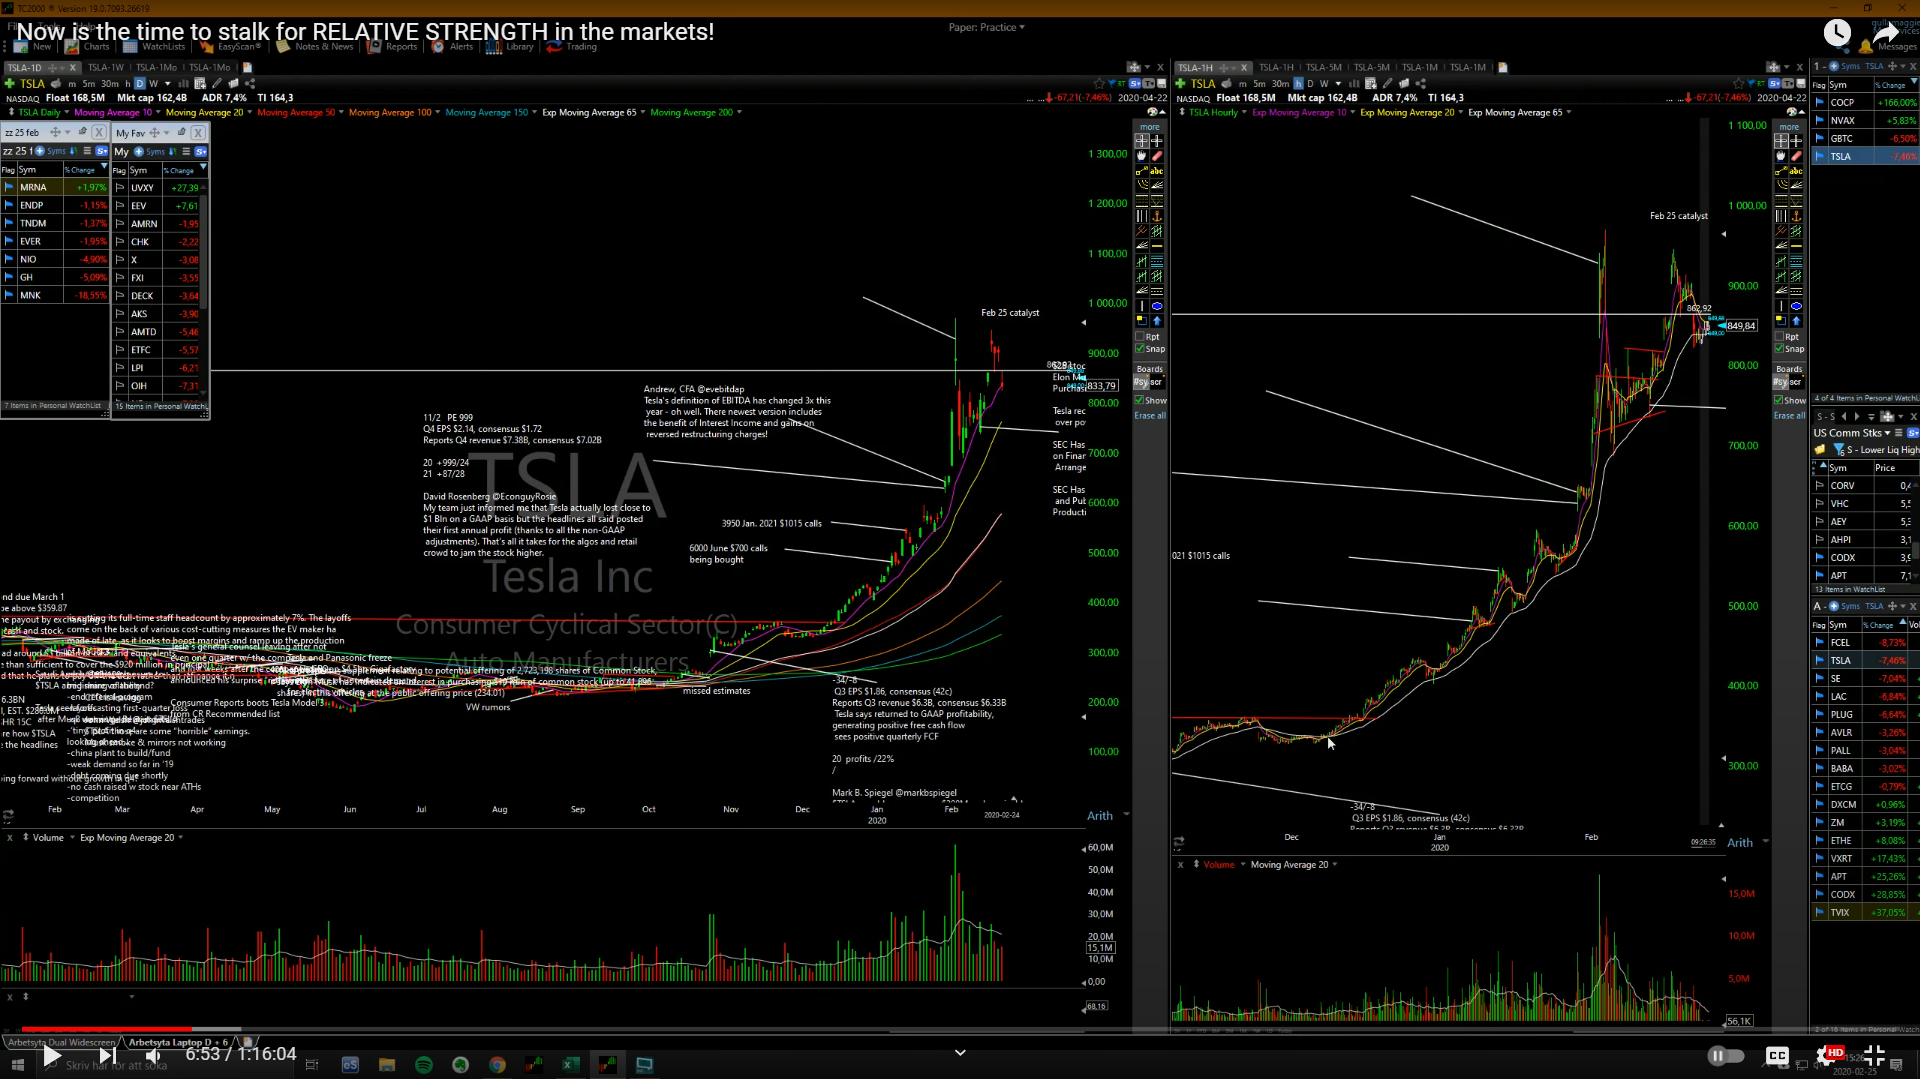 TSLA did tiny starter will add more if it goes red,
 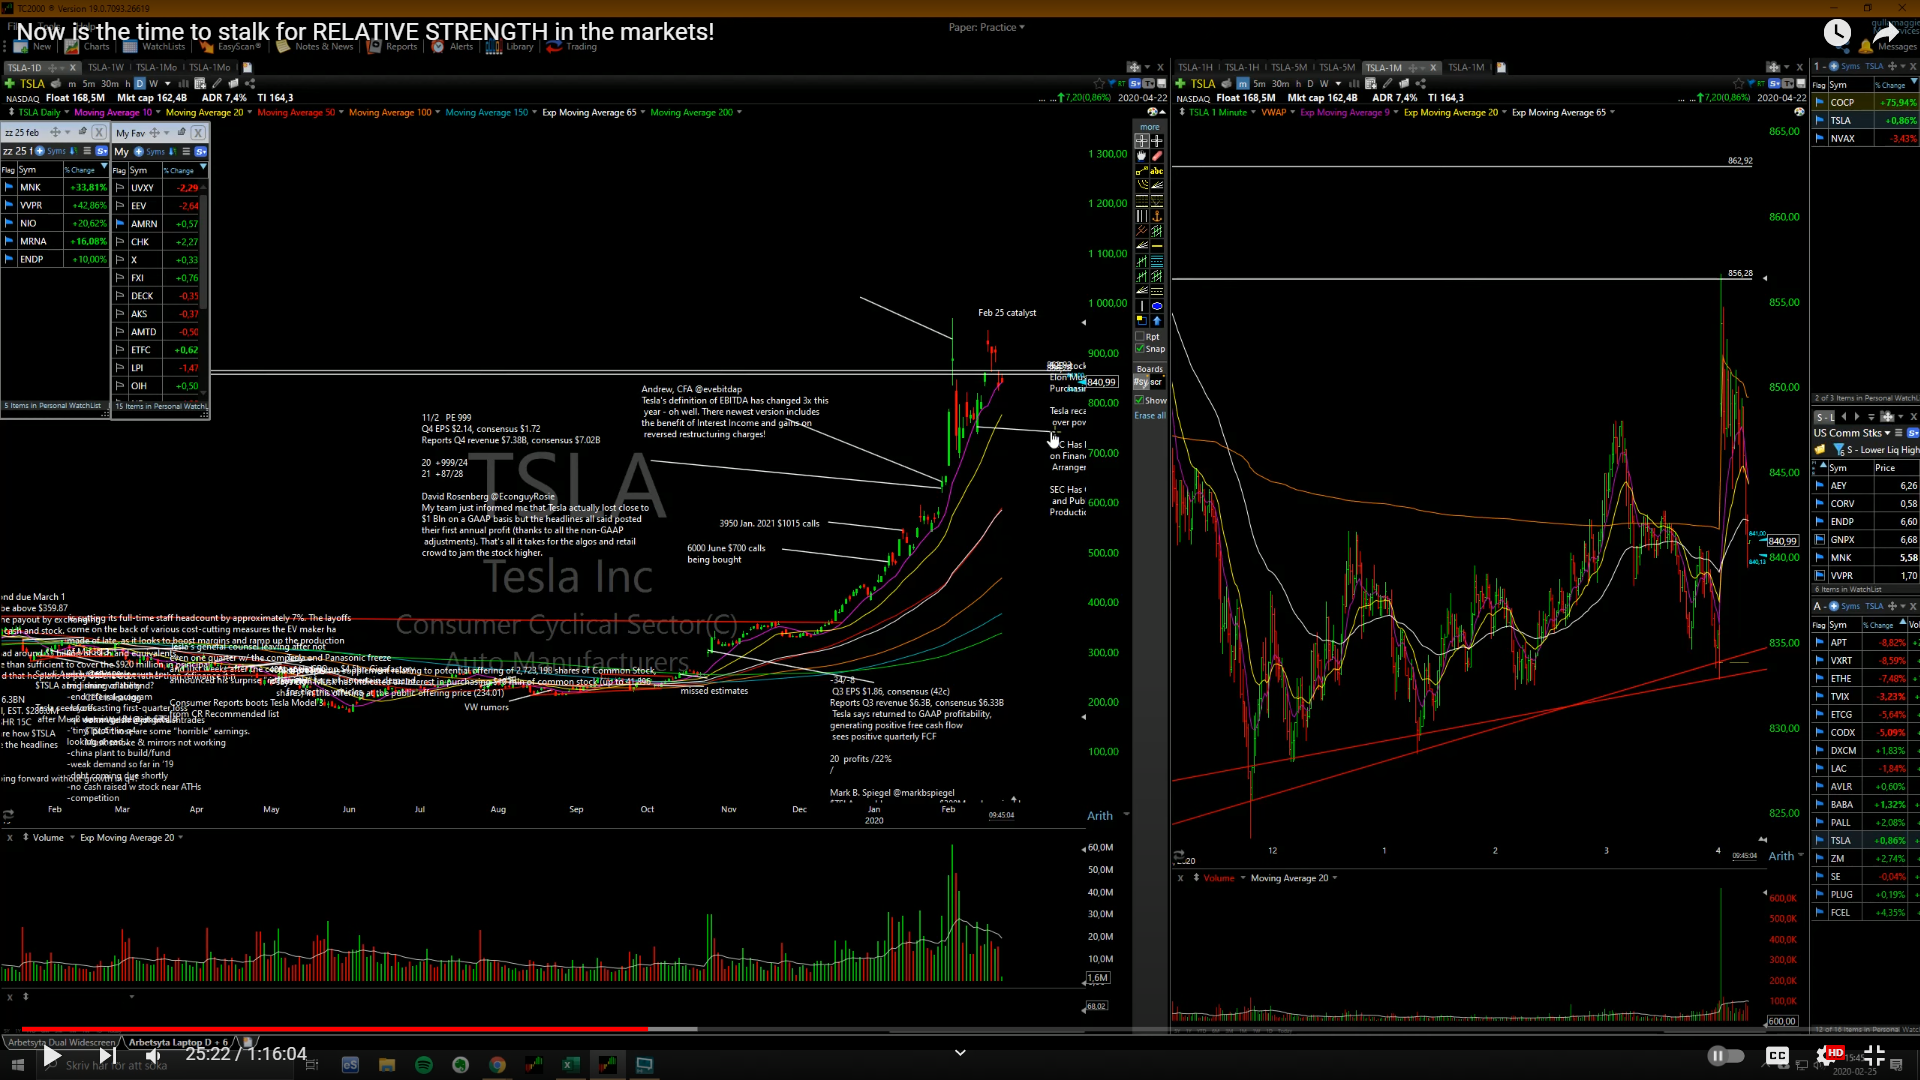 on the 60min has this range here hls and got rejected off these declining emas so far. TSLA added a few more shares, and if it can go sideways here build a tighter range on the 60min then break lower I will add more, but don’t wanna go crazy here since TSLA has been showing some rs.
 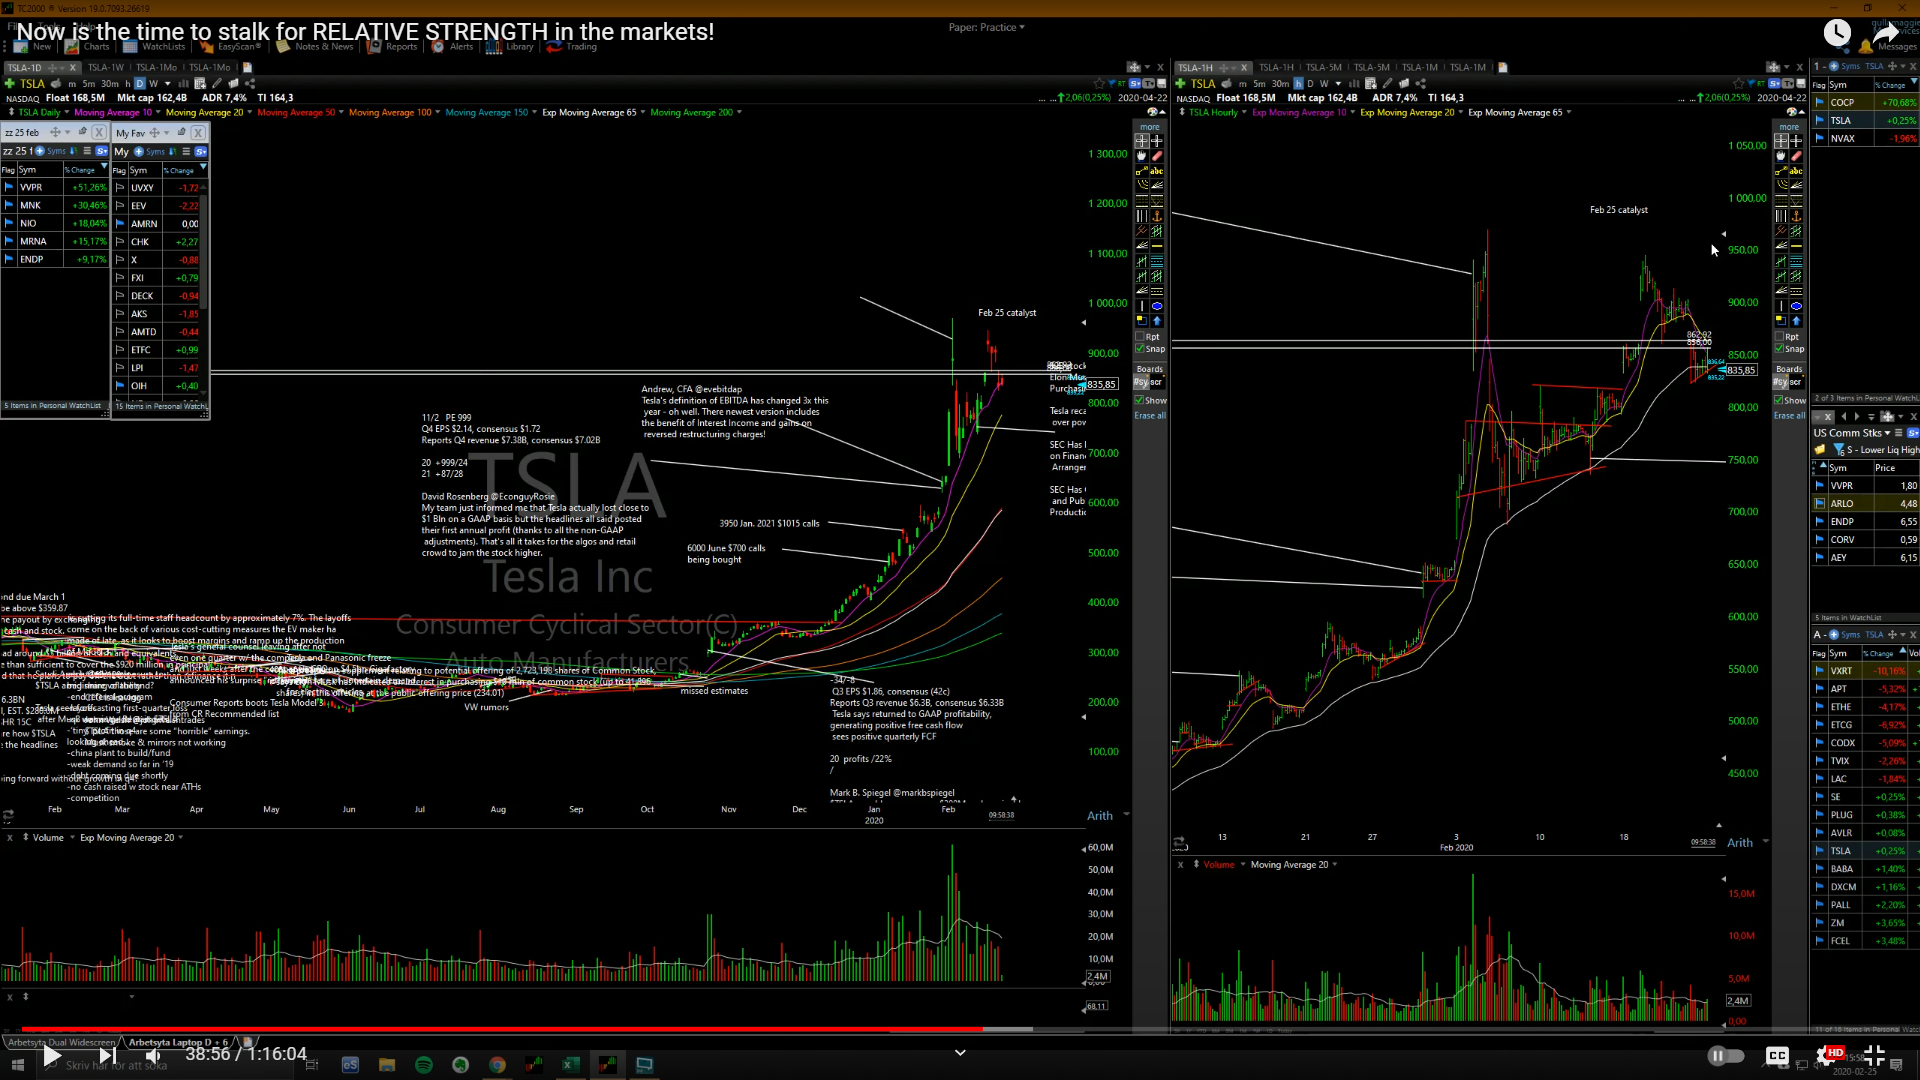 TSLA damn I don’t have enough, I’ll cover some tiny.
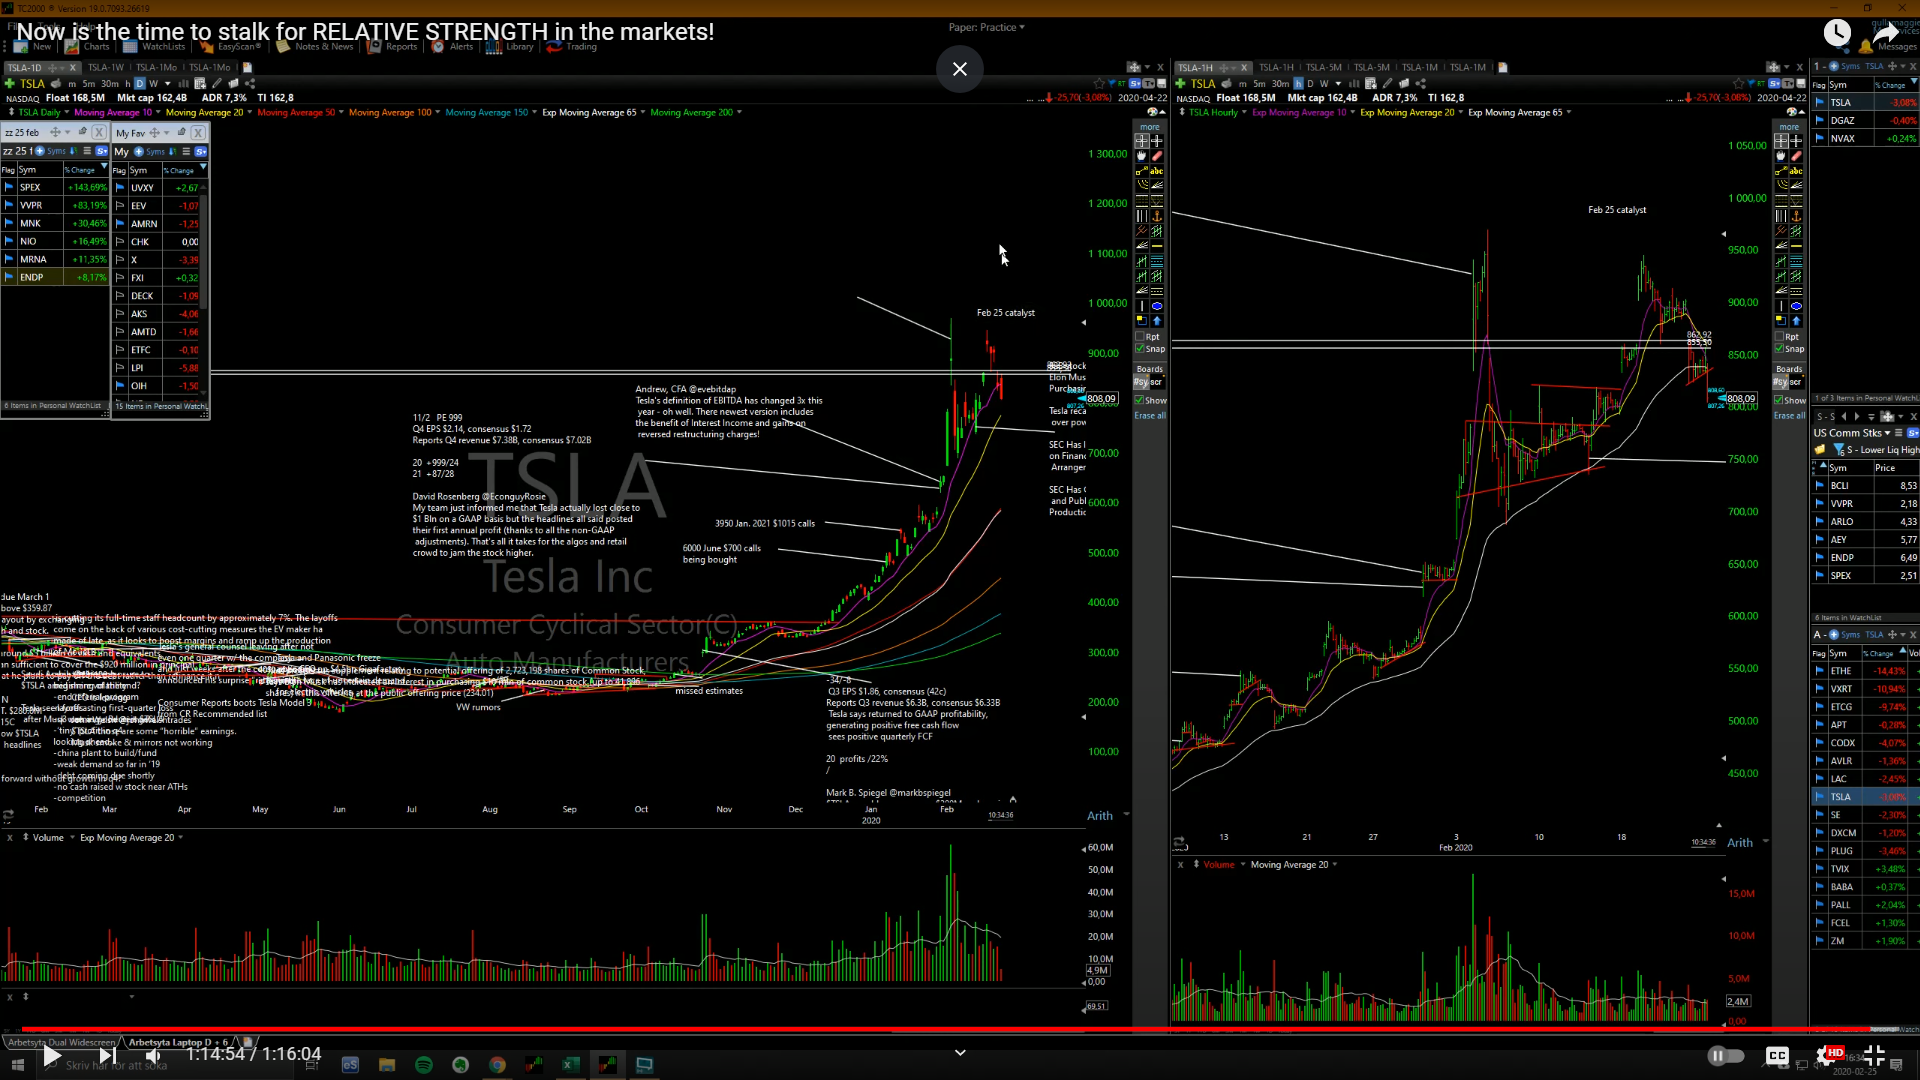
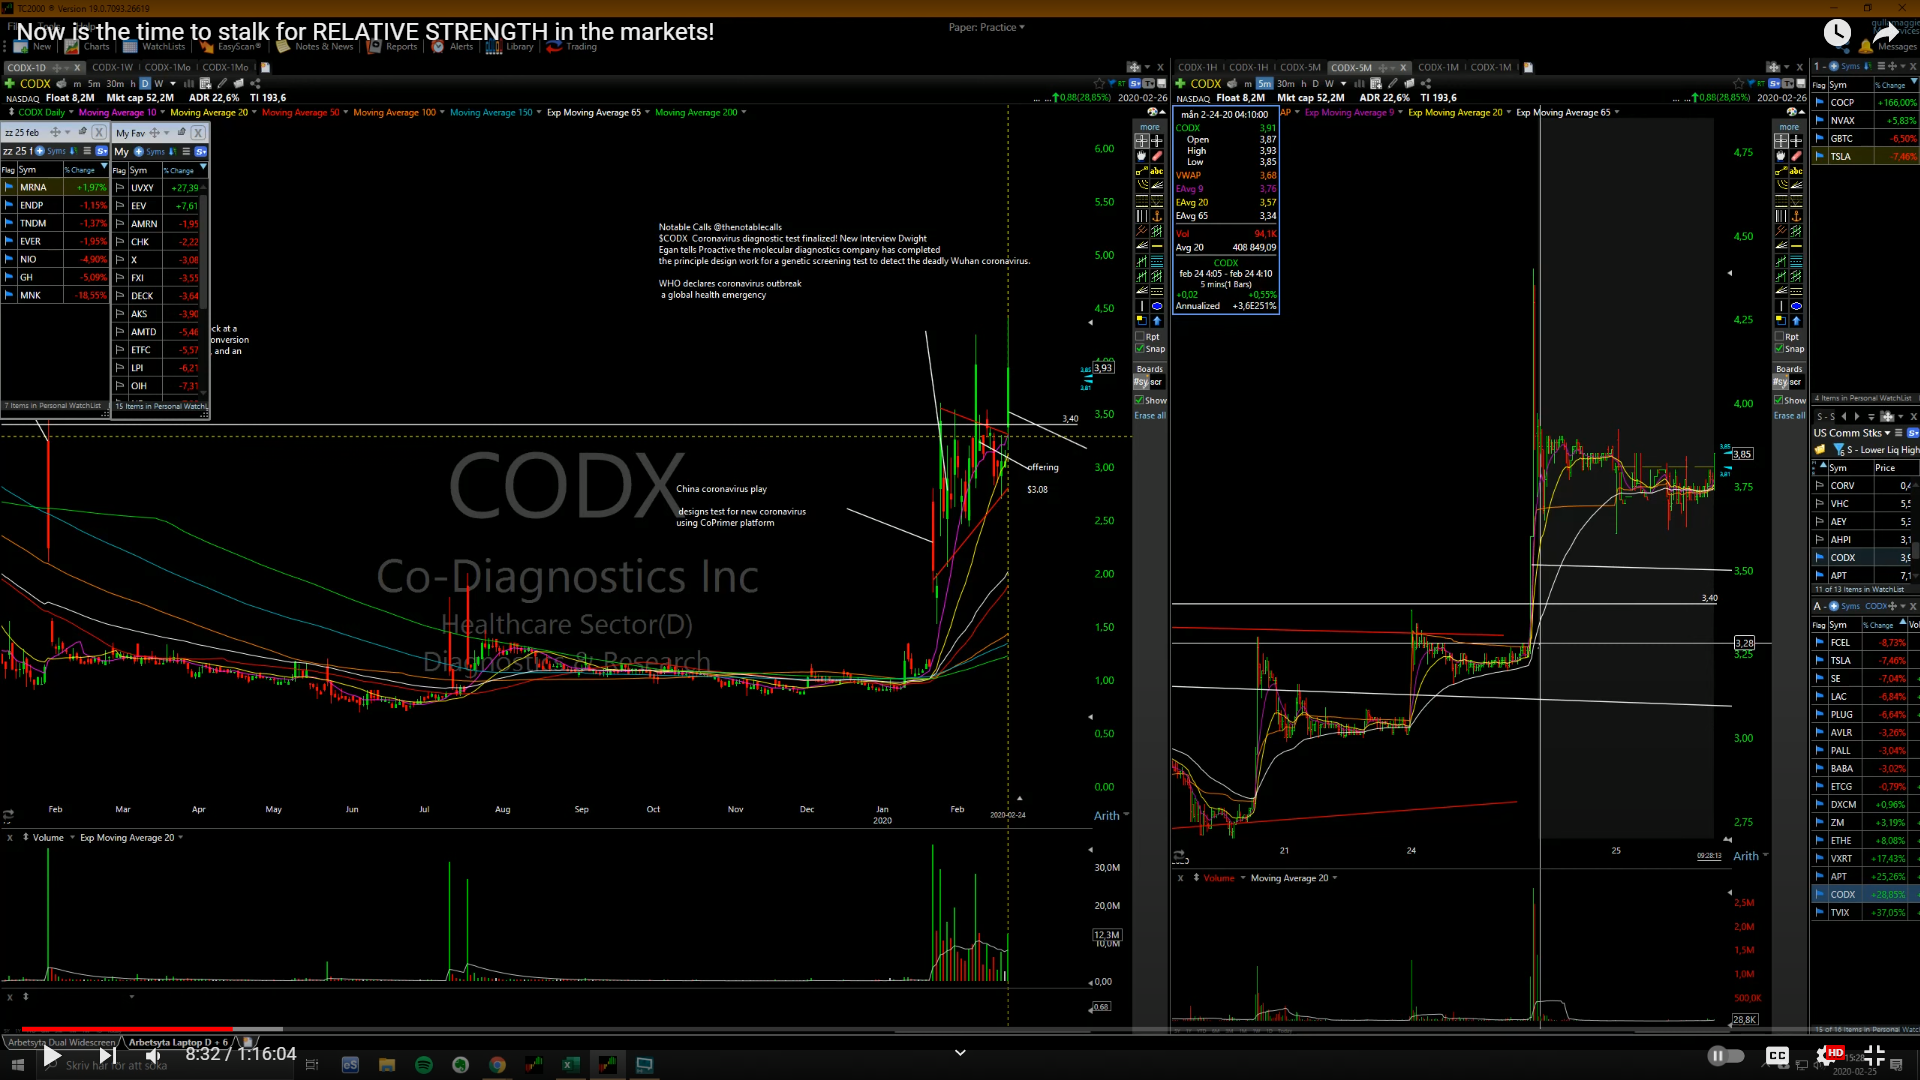 Really happy about it. I missed the sells here at the top but sold some in the low 4s. I’ve been talking about this thing a lot, first level to break was 3.30s, then the 3.50 area. I think it could double go to $6/7 look at this triangle it’s been building the past month or so, higher lows all the way.
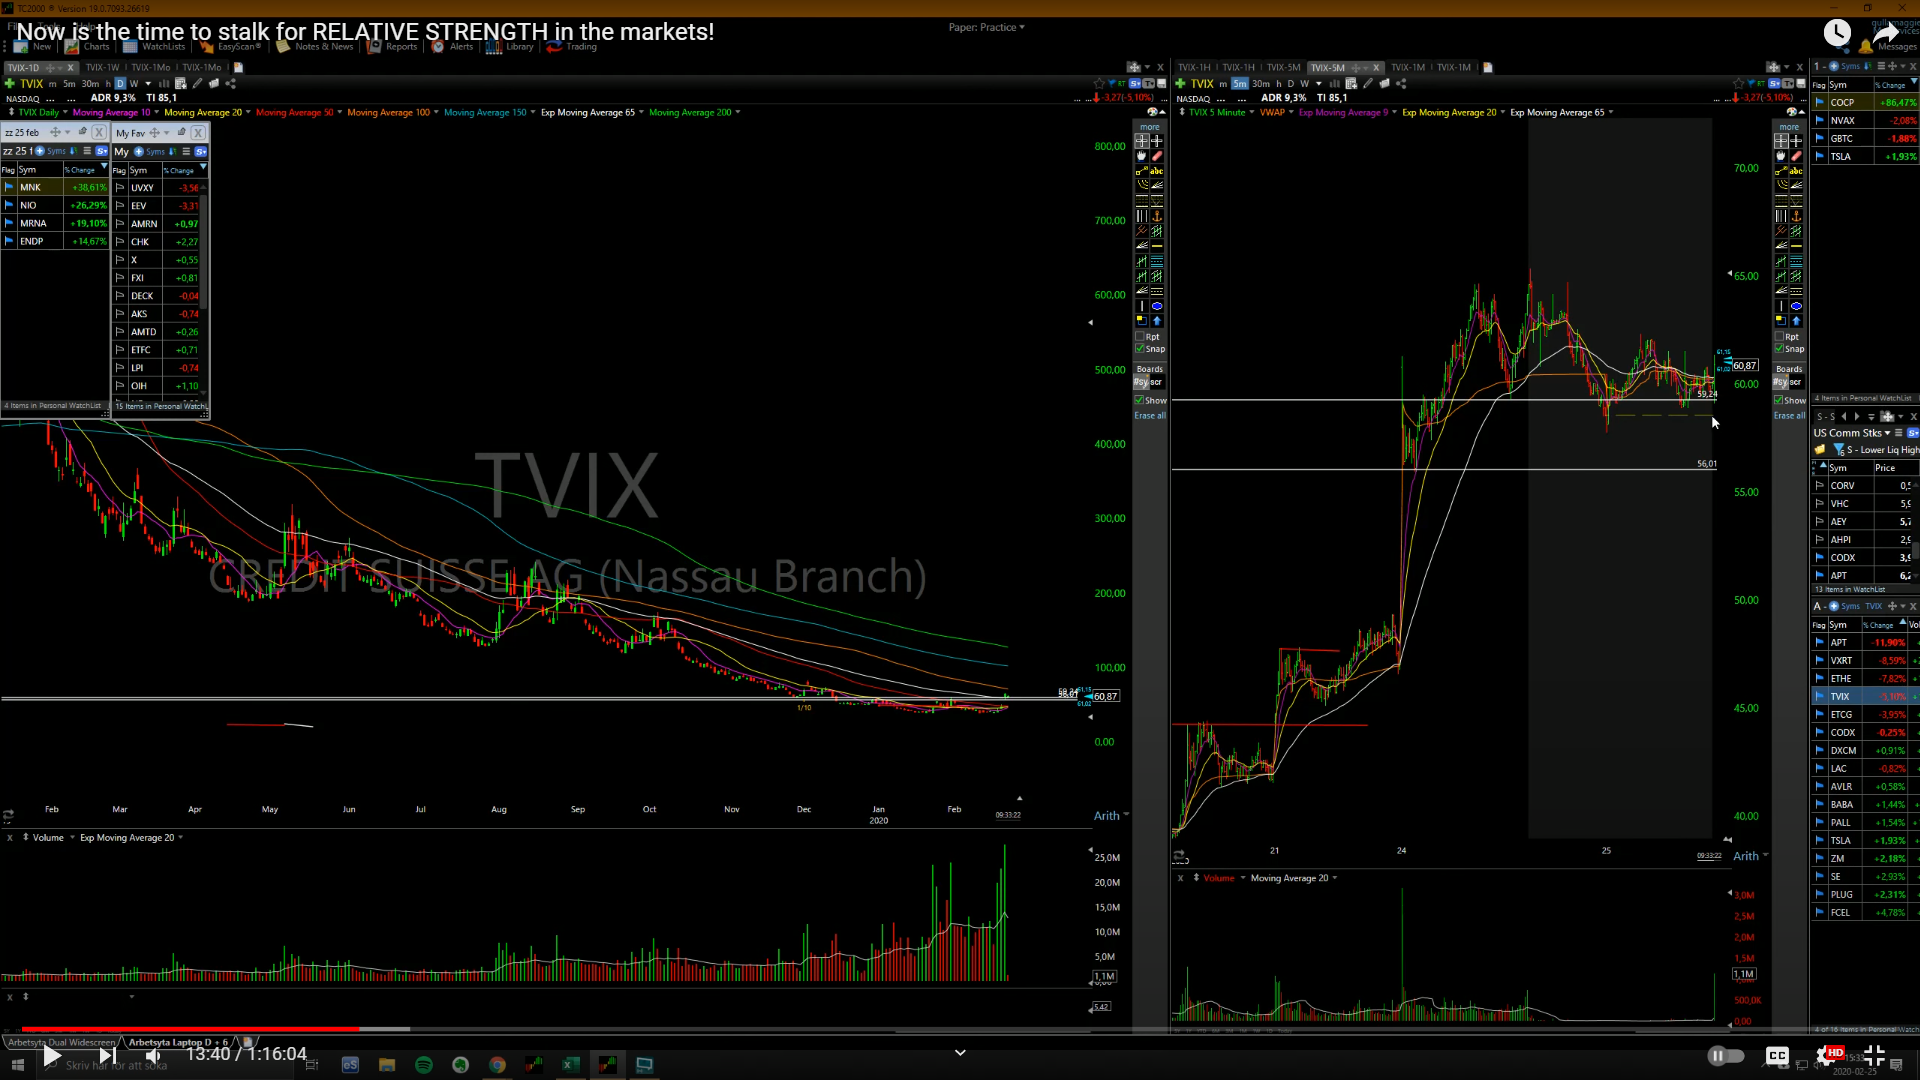 TVIX gonna sell some here sell down a little bit, going straight up, this is what I was afraid of the gap up and crap, I wouldn’t be surprised if we pull back to the rising 200 day on the major indices, this has been support for the past two dips, back in may&oct2019, that also happens to be the area where the market broke out, so that’s like a double support there.
 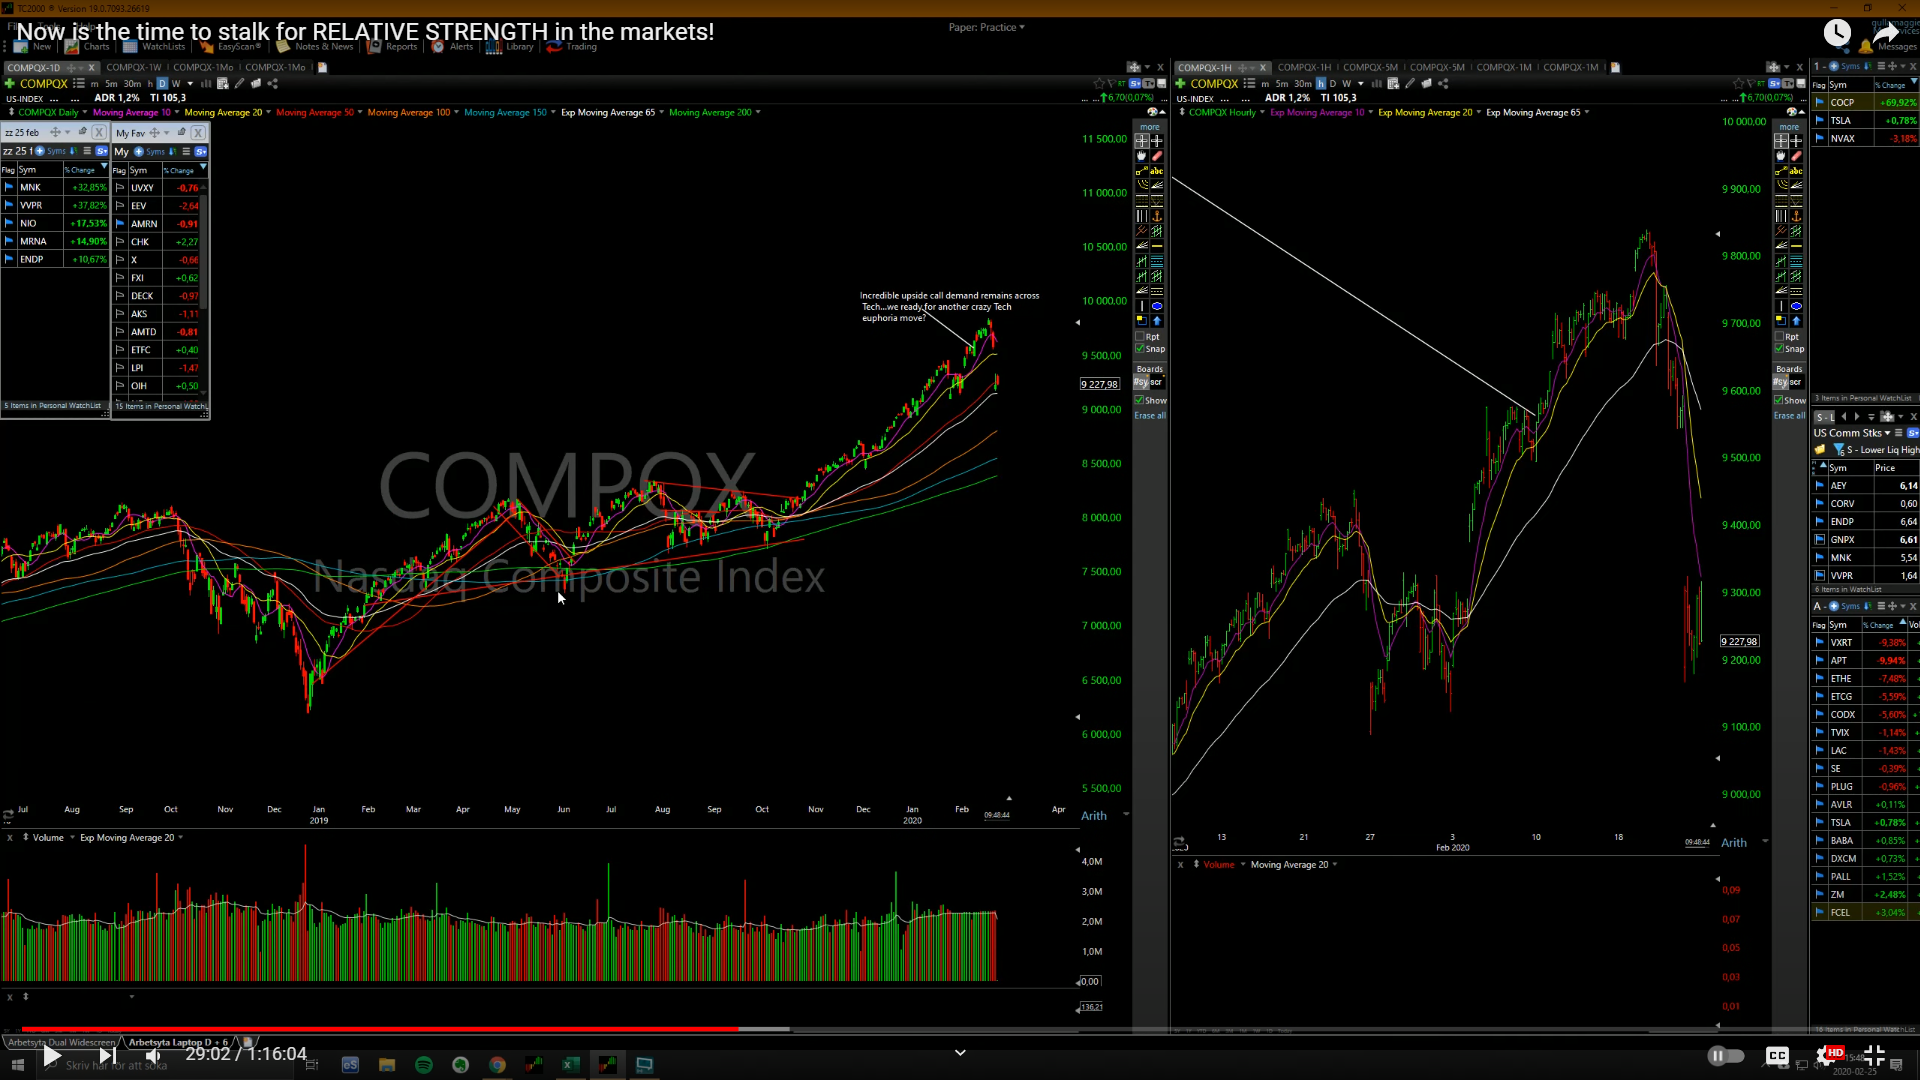 I think we have entered into a choppy market, I don’t think breakouts will work the next few months, even if we don’t pull back more, I think we chop around. The ideal scenario is if we get a violent pullback to the rising 200 day, or even undercut it, get it over with quick. It’s impossible to predict what the markets will do, but it’s good to have some potential scenarios in mind. TVIX gonna add a few thousand gonna anticipate hod break. This thing could easily go up 100%+, if you look at any past correction, back in Sep/Oct2018 it was up 130%,
 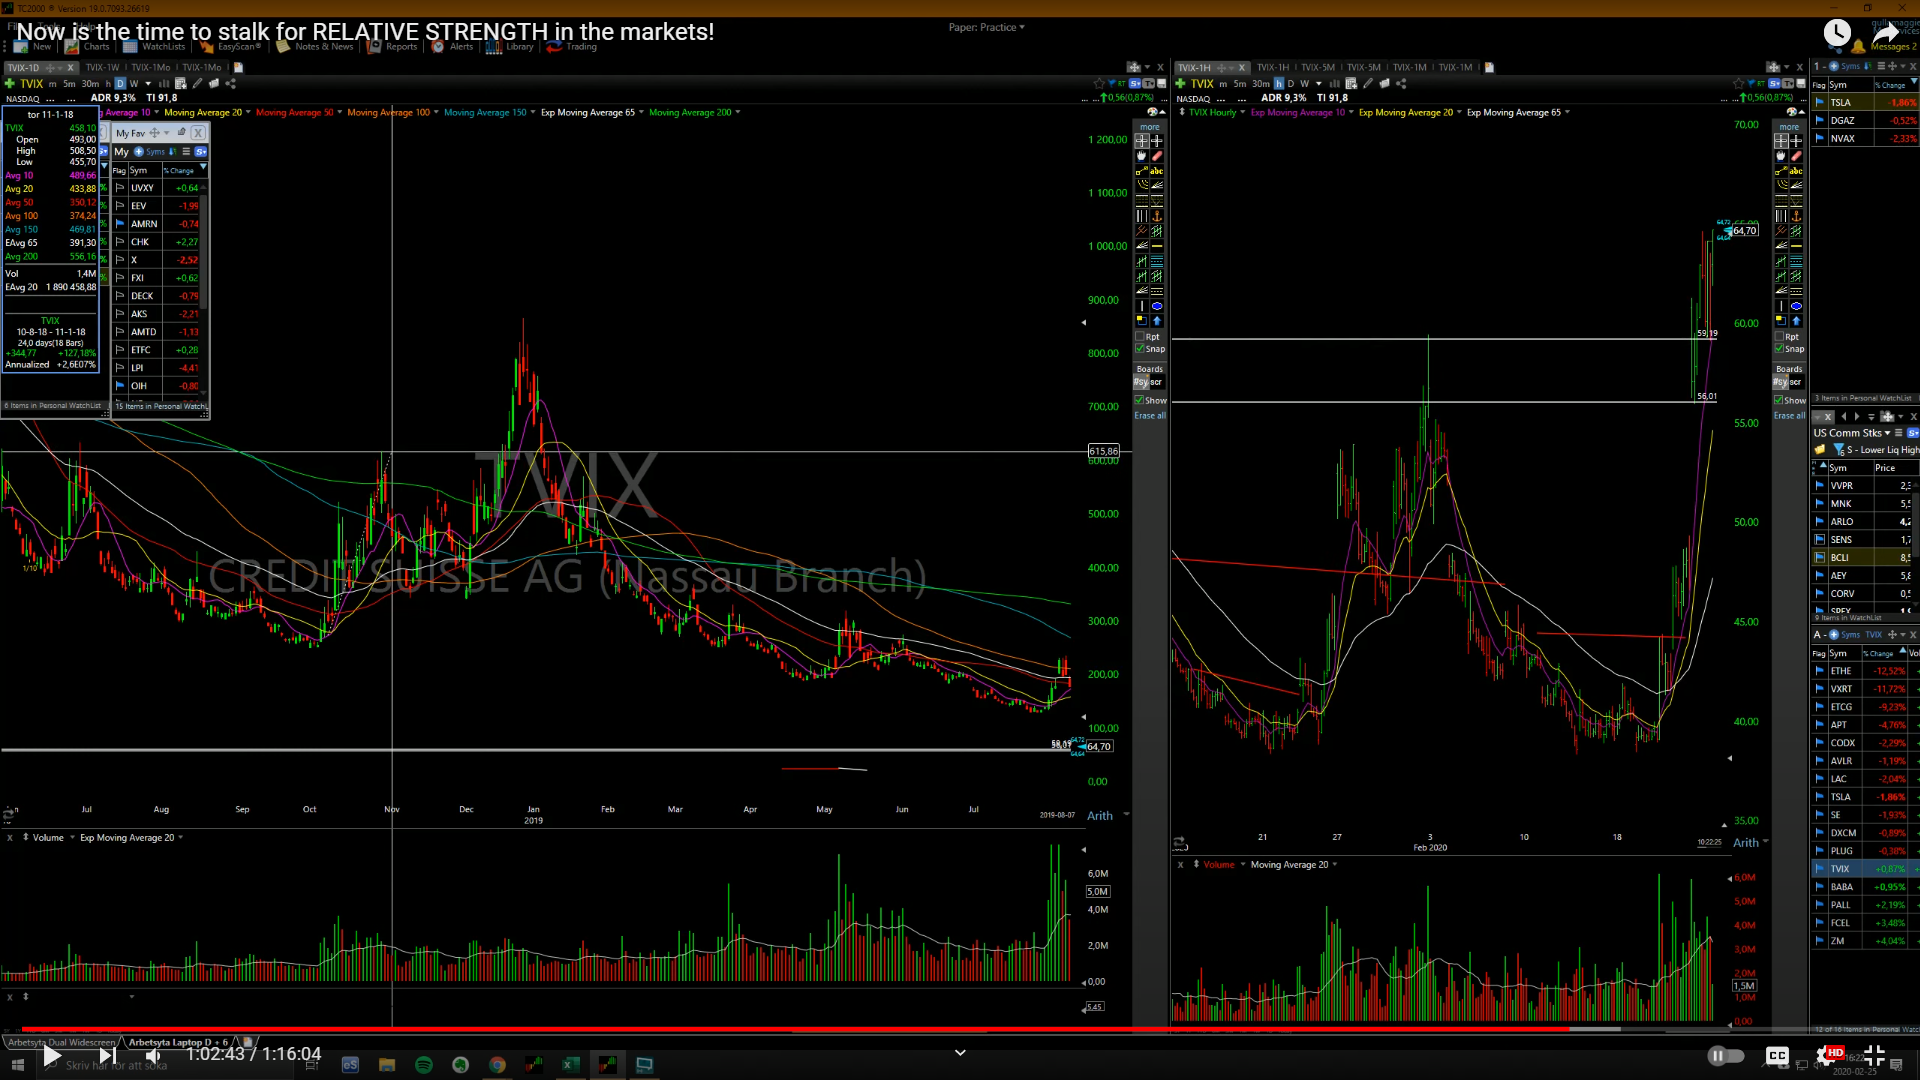 then another 100% in Dec. In early 2018 this was up 180% in a few days,
 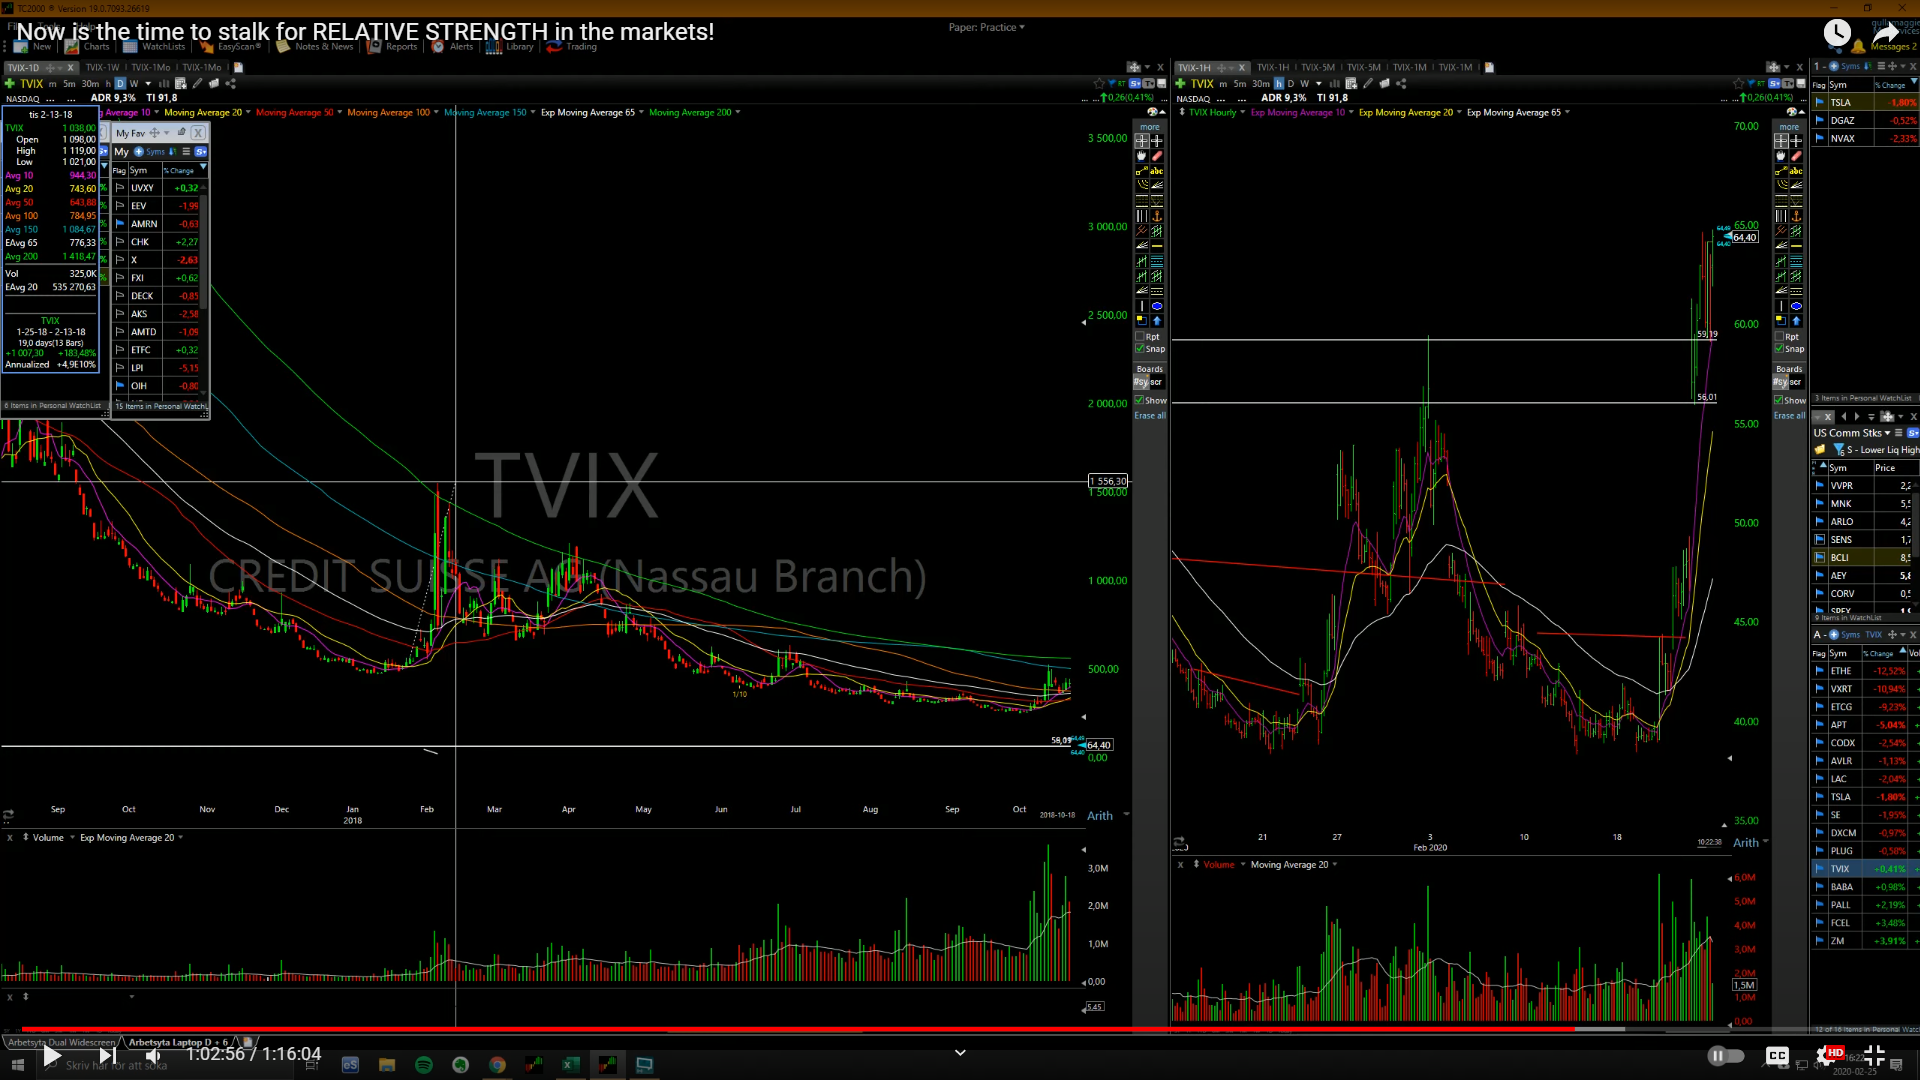 Aug2015 was up over 200%.
 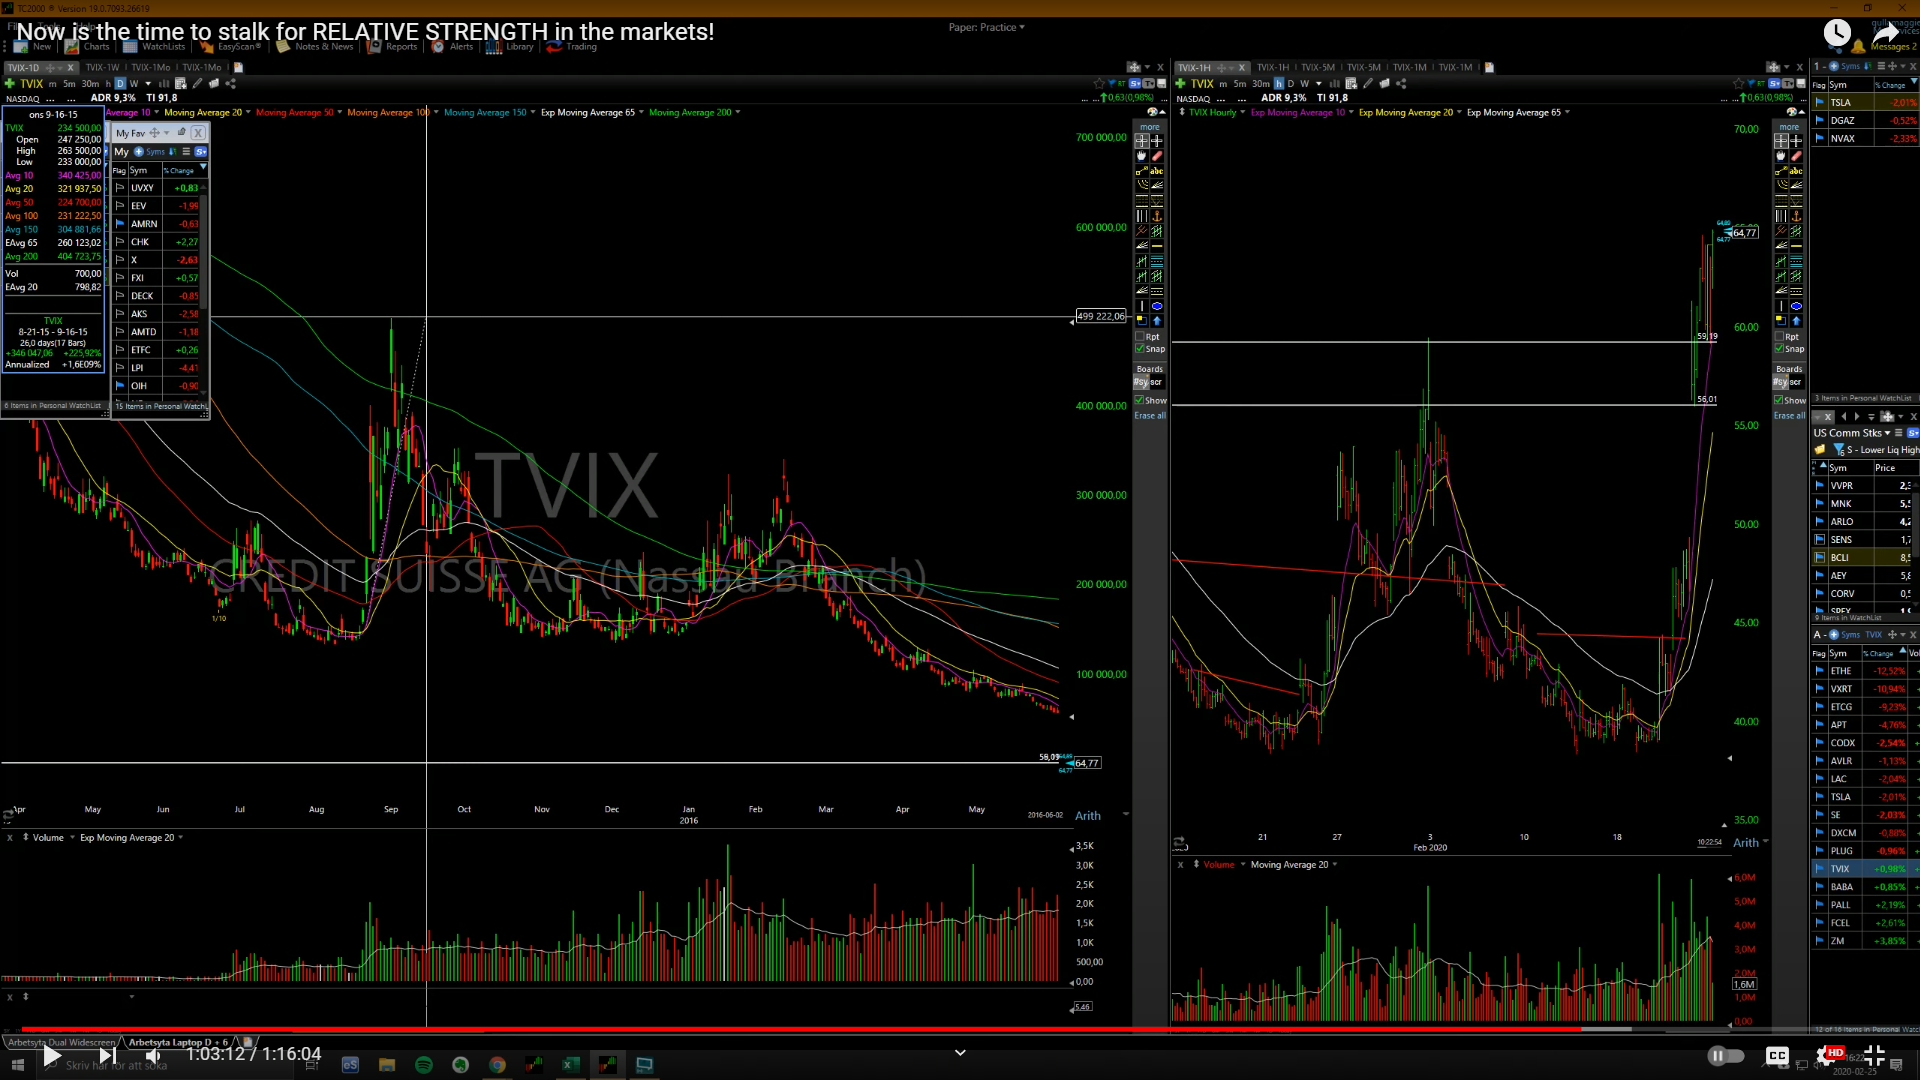 Added a few more not gonna go crazy on it 1700shares. Ah when TVIX goes to 80 I’m gonna wish I added even more. Okay I added a bit more.
 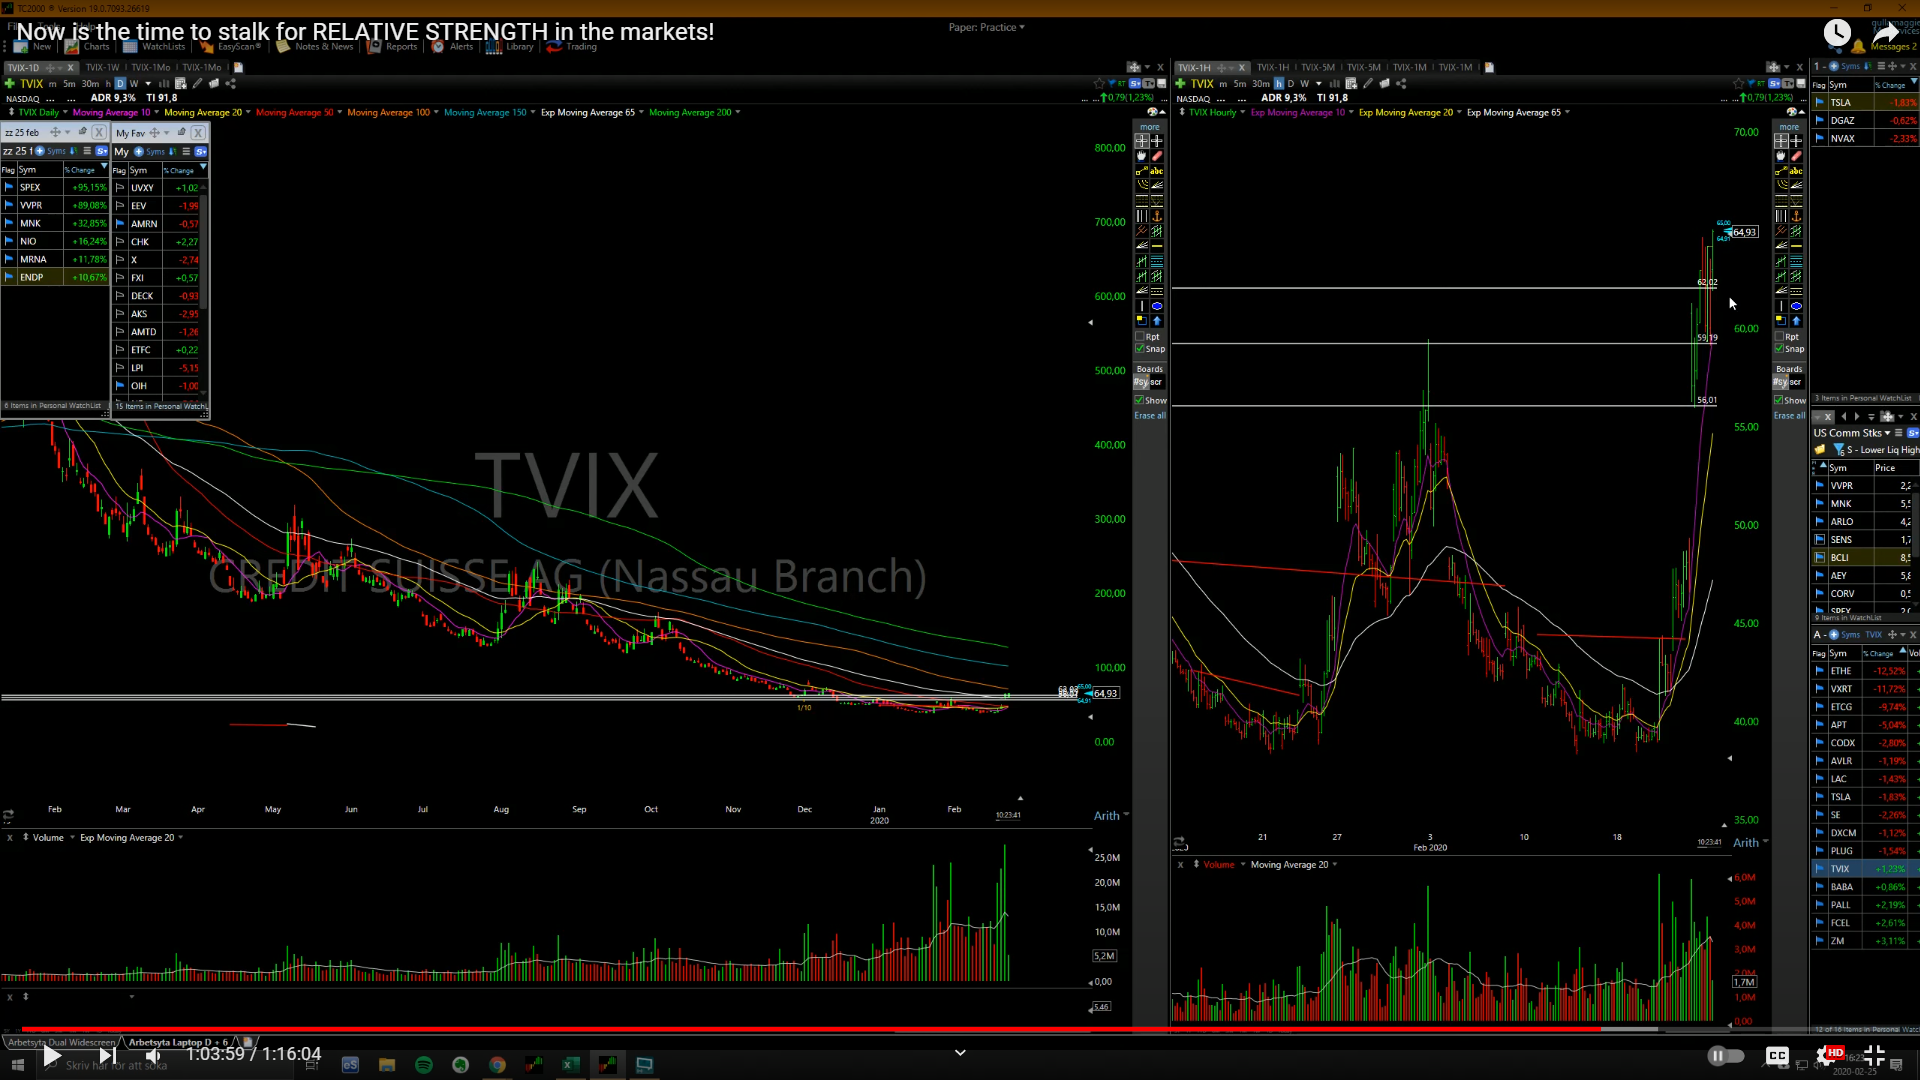 TVIX has the most volatility of all these volatility products, I’m using this because I don’t have to use as much bp to get the most bang for your buck.
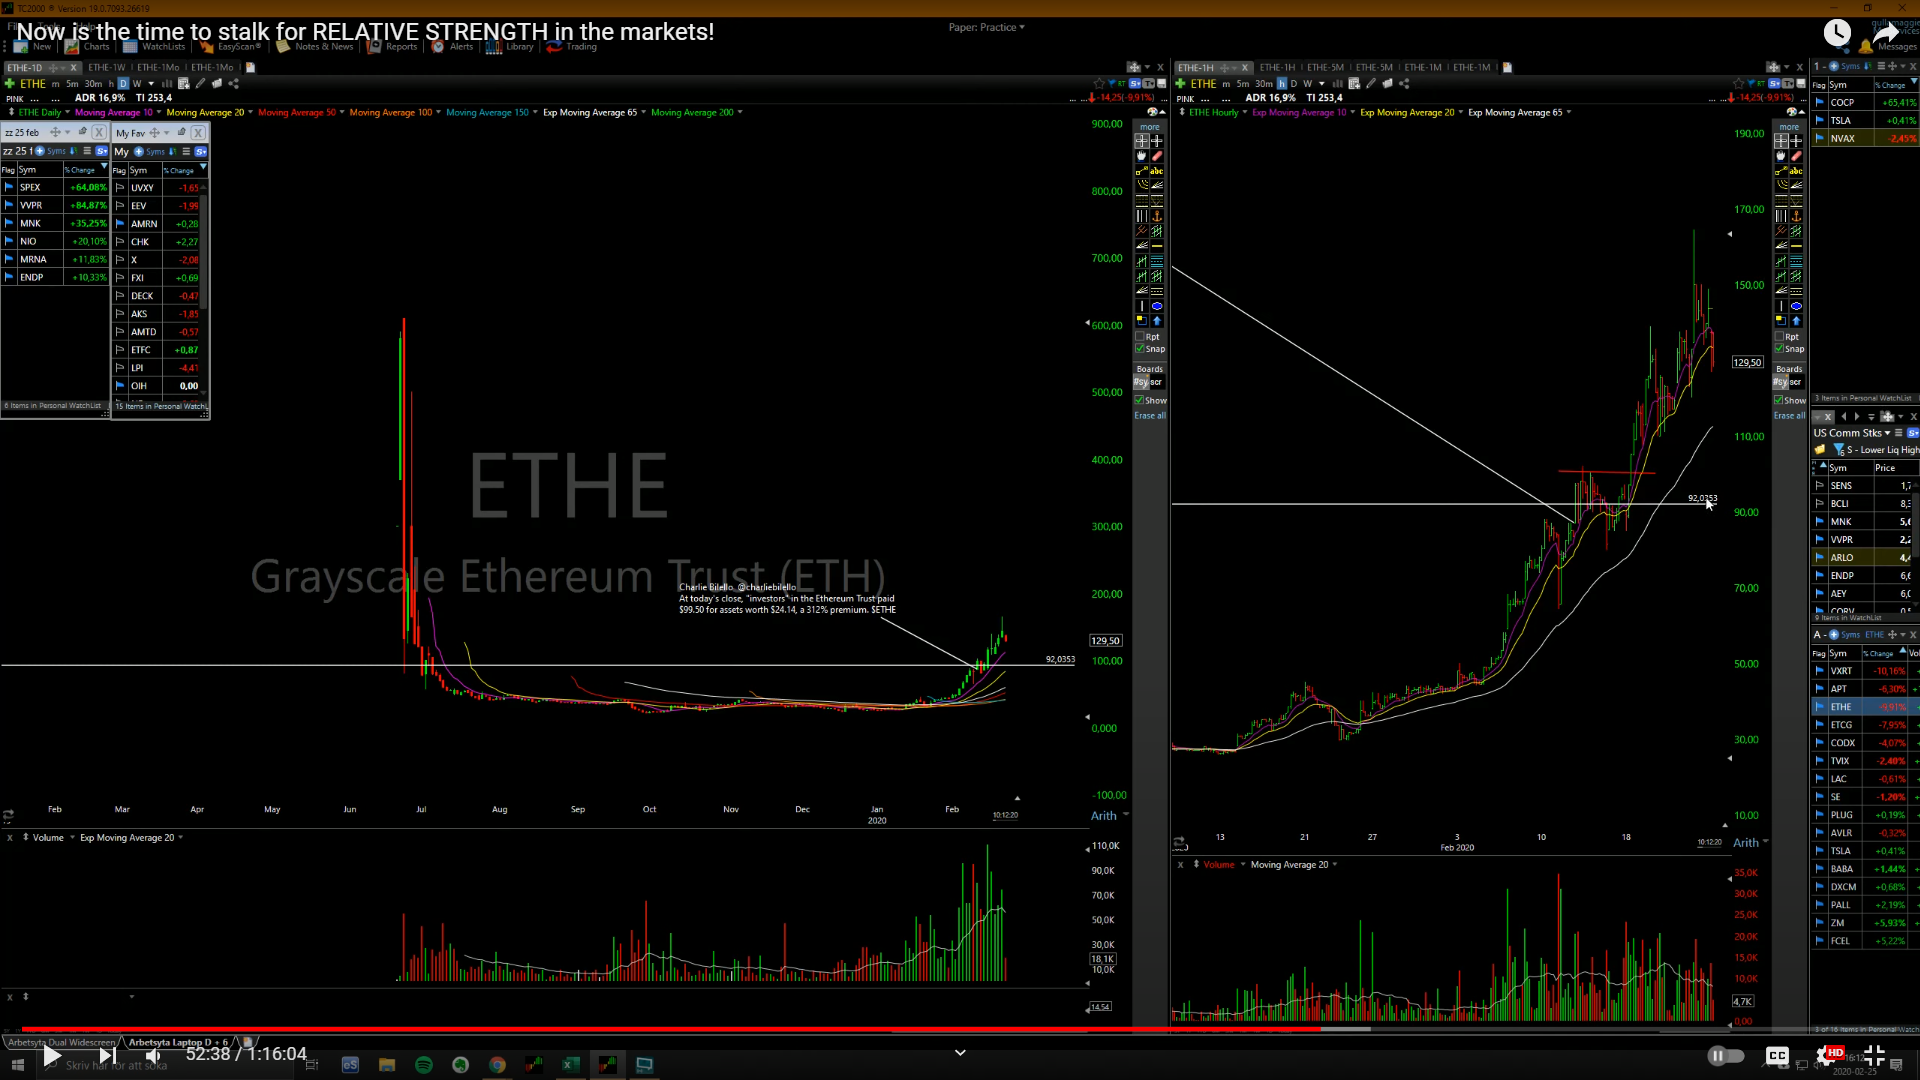 ETHUSD resting right at the 20day, if it starts breaking below that I would size down both.
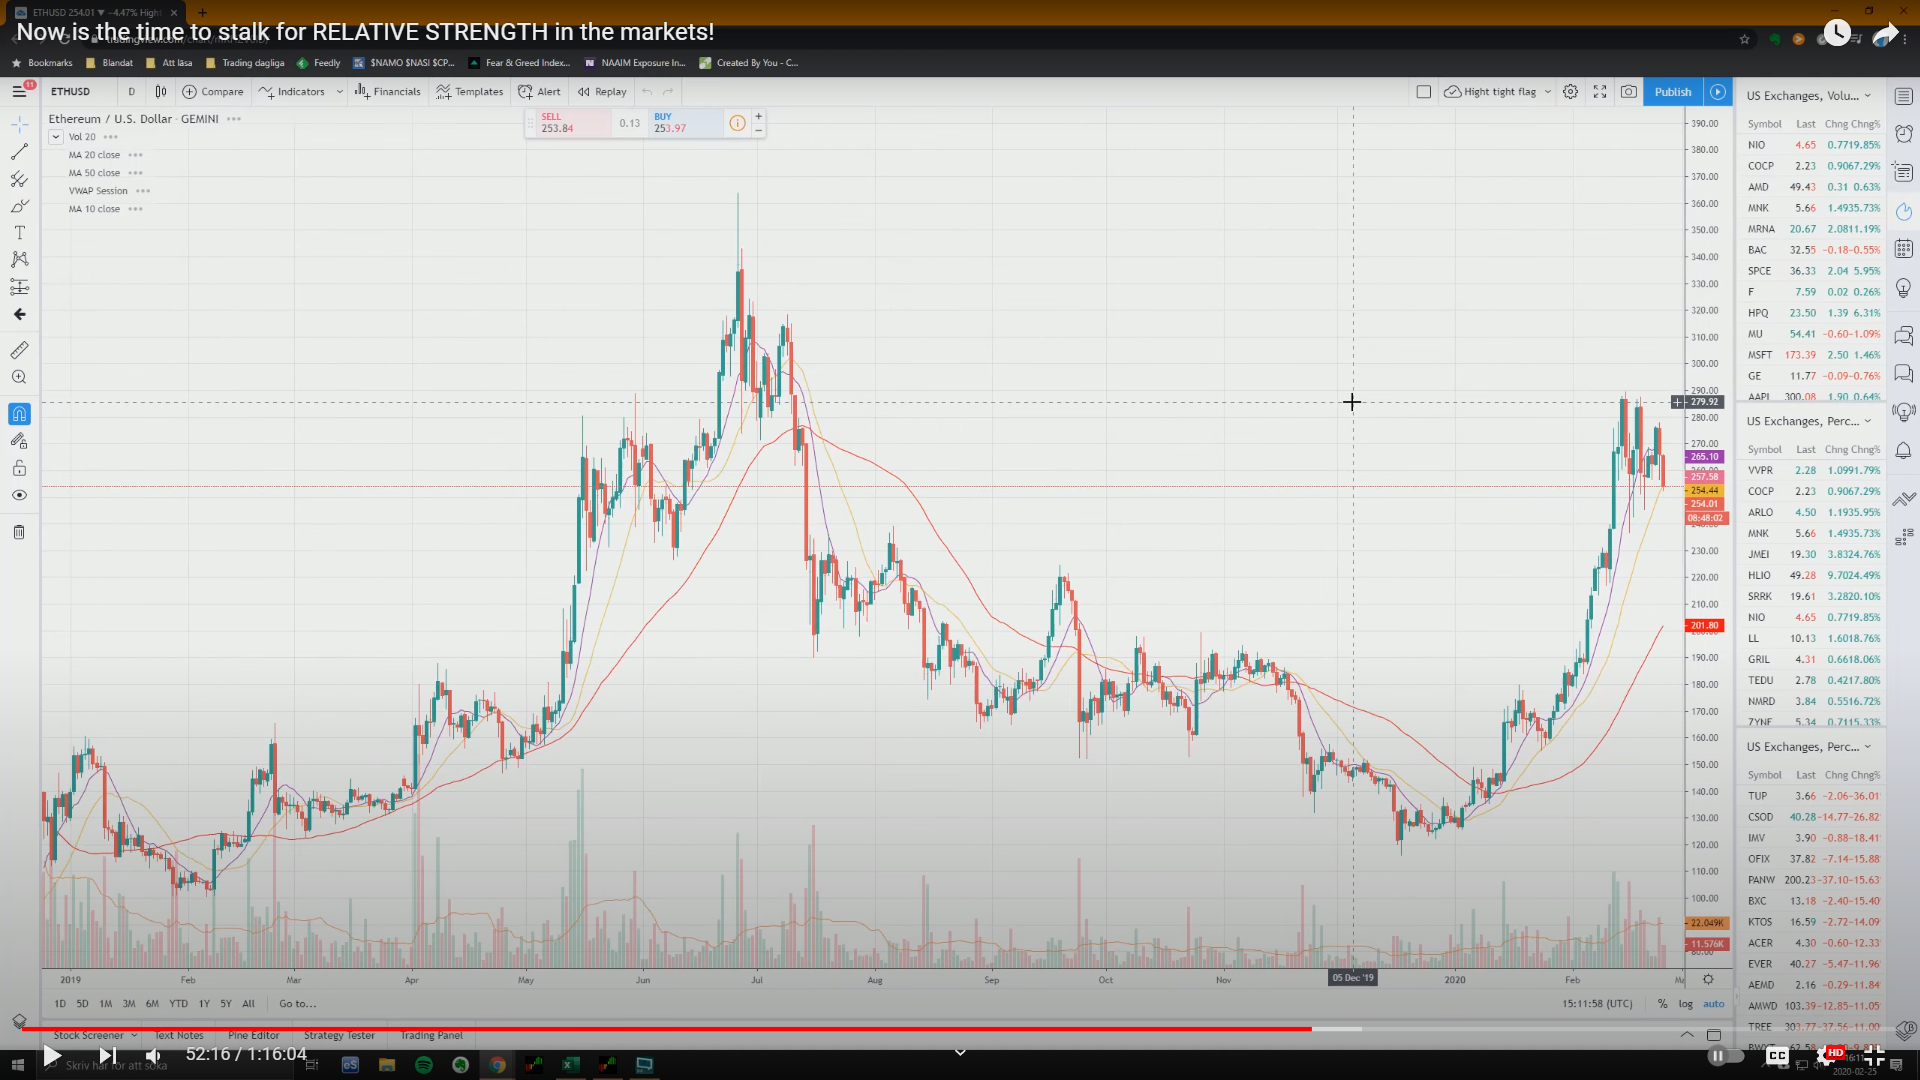
 APT, same time as markets went lower, had a 300% run, and it peaked a day before market bottomed,
 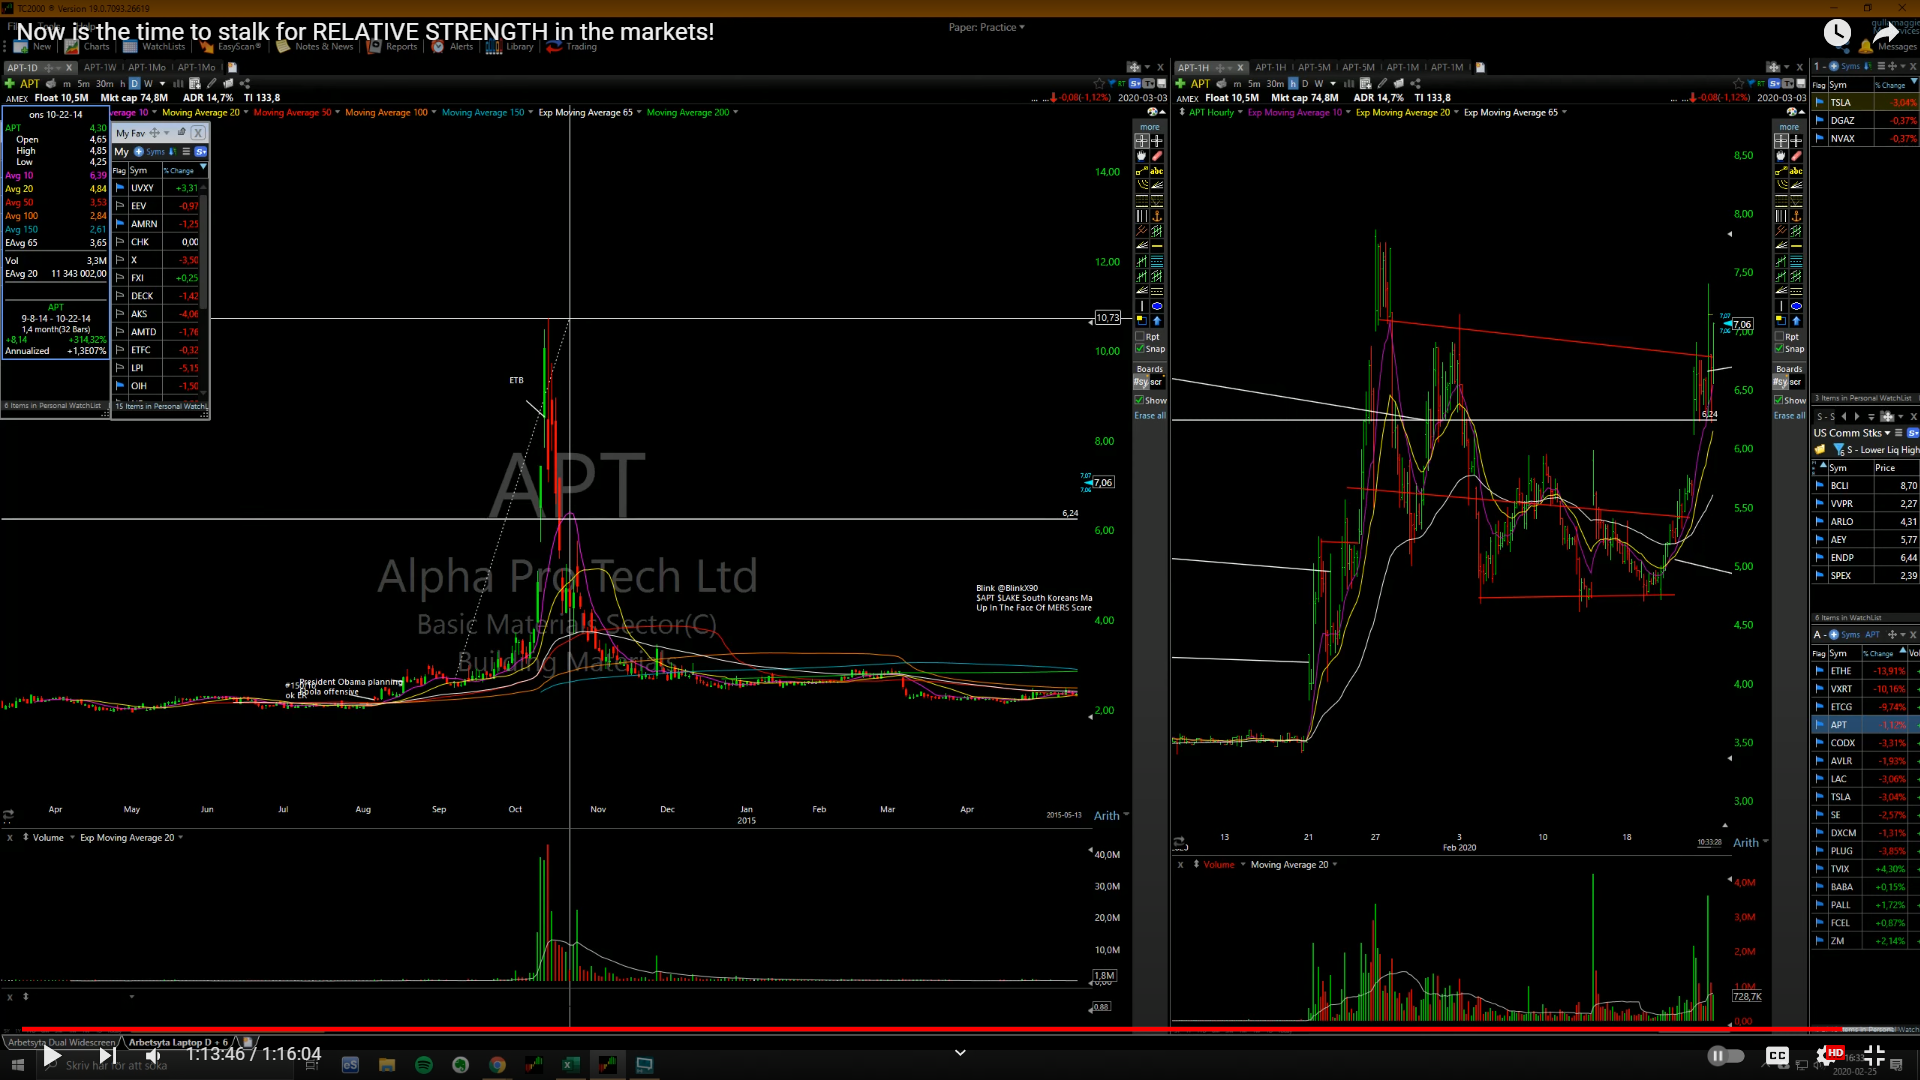 same thing with LAKE.
 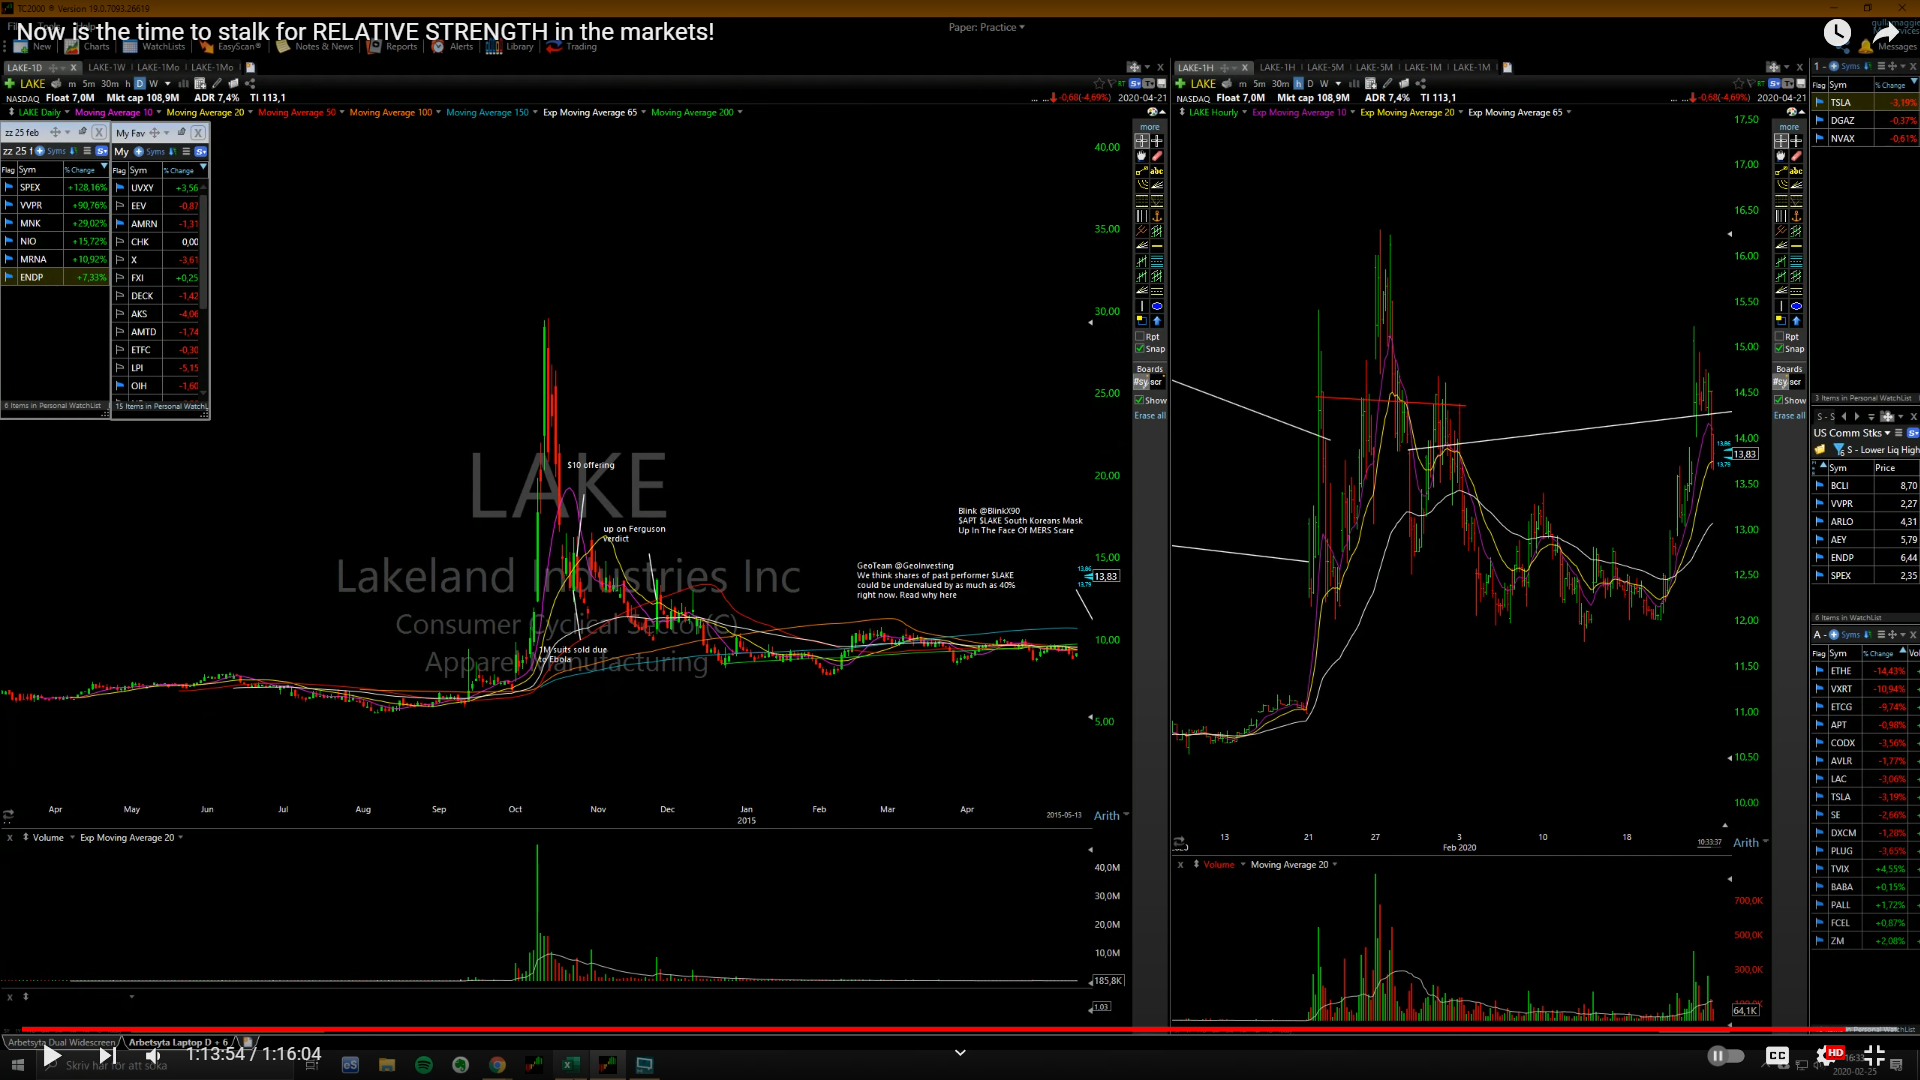 So these corona stocks could do the same thing now.