DRIP, DWT, watching for potential mean reversion trade, looking for some kind of blow off, lhs, orls etc, for a day trade of short term swing trade. DWT just lost orls, I’ll do a few then add on a good setup. Htb, I missed my entry. Shorted some DRIP instead. I’m risking $2.5 with slippage but if it goes down could go $10/15, it’s been straight up for two weeks. Stopped out, woa must have been some oil news. Good thing I got stopped out bc now we’ll get an even better setup, ideal scenario it goes up a lot today stays strong then tomos we get a gap up. If we get a good setup I’ll short again today, but there’s no way I’m shorting now into strength, I want to see some kind of lhs or a rangebreak to the downside if I’m gonna short today. USO look at this oil how it’s down.
FCEL also tracking, they cancelled their atm, they’ve been selling a lot of shares that’s why the chart is down 99% over the past two years, they diluted the sh*t out of this stock but now they cancelled the atm. FCEL has volume, bought 100kshares 3c risk. If it breaks hods I’m prob gonna buy another 100kshares considering the high volume, but prob gonna get stopped out, yep just got stopped out.
OBLN yeah another beaten down name, for those trading these this is the time to get in, you gotta get in right out of the gate. This thing could go to 2.50 pretty easily, but not for me.
TSLA gonna short some orls, they missed their estimates and the chart is really weak. I was a bit too eager, I shorted before the candle confirmed and I got stopped out, lost 3k was a quick loss, but a quick small loss is the best loss. I did some small TSLA 2kshares, I wanted 3kshares but I missed the entry, I’m in from a dollar lower than where my entry should have been.
OKTA undercut this rising 200day and now it’s breaking a range to the upside. This has been one of the biggest leaders of the past couple of years.
This is how I trade, I usually have lots and lots of very small losses, and a few big wins. So I have no problem taking these small losses on these things, bc all I need is to catch one or two and I’ll make it all back and much much more.
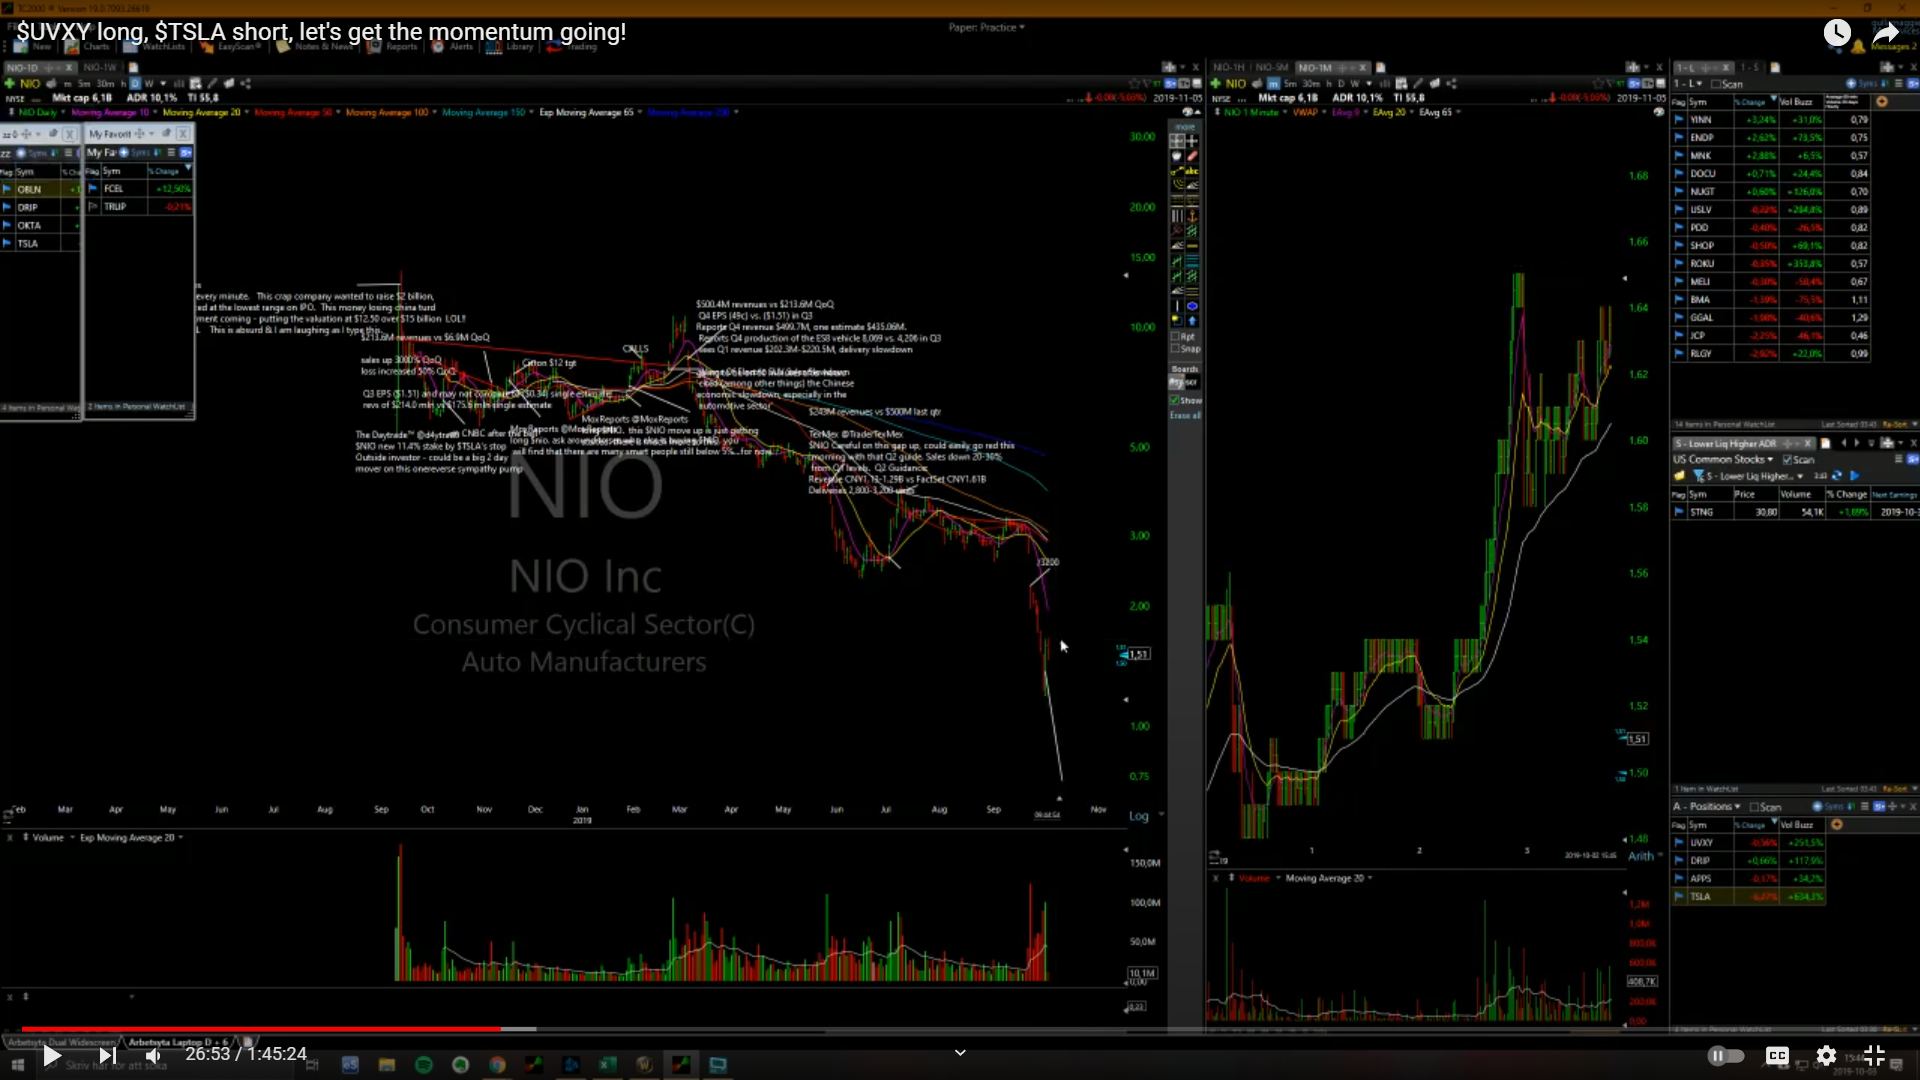
NIO had a huge reversal yday, I passed on it I was hoping for more downside, hoping the mean reversion would happen today but it happened yday, look at the move orhs went from 1.23 to 1.65 that’s like 35% intraday not bad.
The same patterns you see on the daily chart, you can trade them off the intraday chart too. I did trade intraday flags, if you have stocks gapping up on earnings or something, then it went sideways most of the day then the last couple of hours set in a tight range in a flag then started going up late day, those types of patterns I traded all the time, very common during earnings season, you get a few good ones almost every single day, you just wait for something that’s up on big volume then just wait for a setup. It’s all about getting tight setups, tight stops you can get potentially good r/r trades. I also shorted a lot more than I do now.
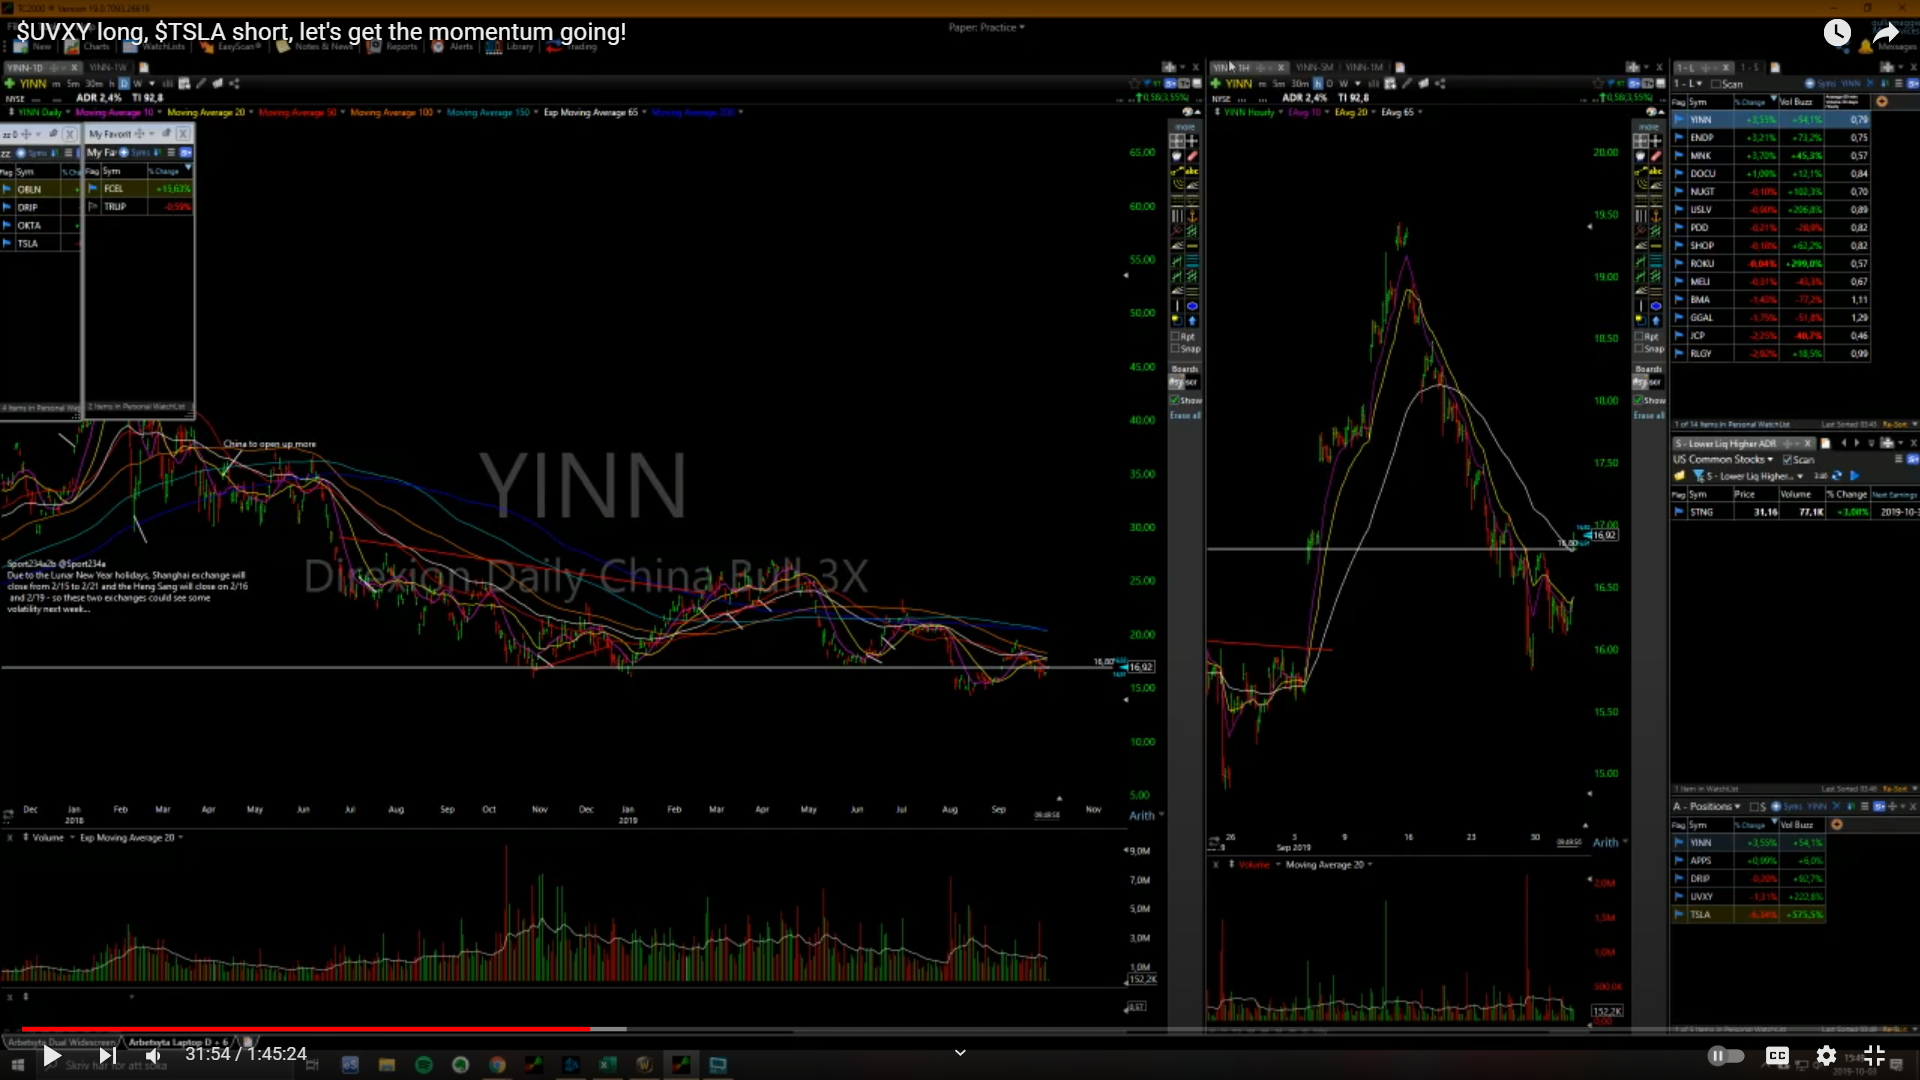
YINN orhs almost breaking I’ll buy it here 15kshares, 15c stop with slippage, very small risk on this trade so I don’t really care if it stops me out without officially triggering.
MNK not going away, just not going away, I just bought 50kshares, I’m willing to buy more if it gets some volume, this is just starter size, I want confirmation. These small cap names don’t care about the market, when they go they go. It kinda looks like it coiling here, if you see put in a bit of a rounded bottom with hls. These beaten down stocks can make huge moves even though their fundamentals suck, just bc they get over priced to the downside, then funds realise like this is really cheap then they go up a lot. I bought this breakout here [Jun2018] nice little breakout perfect looking flag, hls all the way got a range.
UVXY gonna lock in some, sell 1kshares of 20kshares, this is what I’m talking about small tight stops to get multiples on that, 15c stop and I’m up $1.50 on it, already up 10x my R, this is what trading is all about multiples on your R.
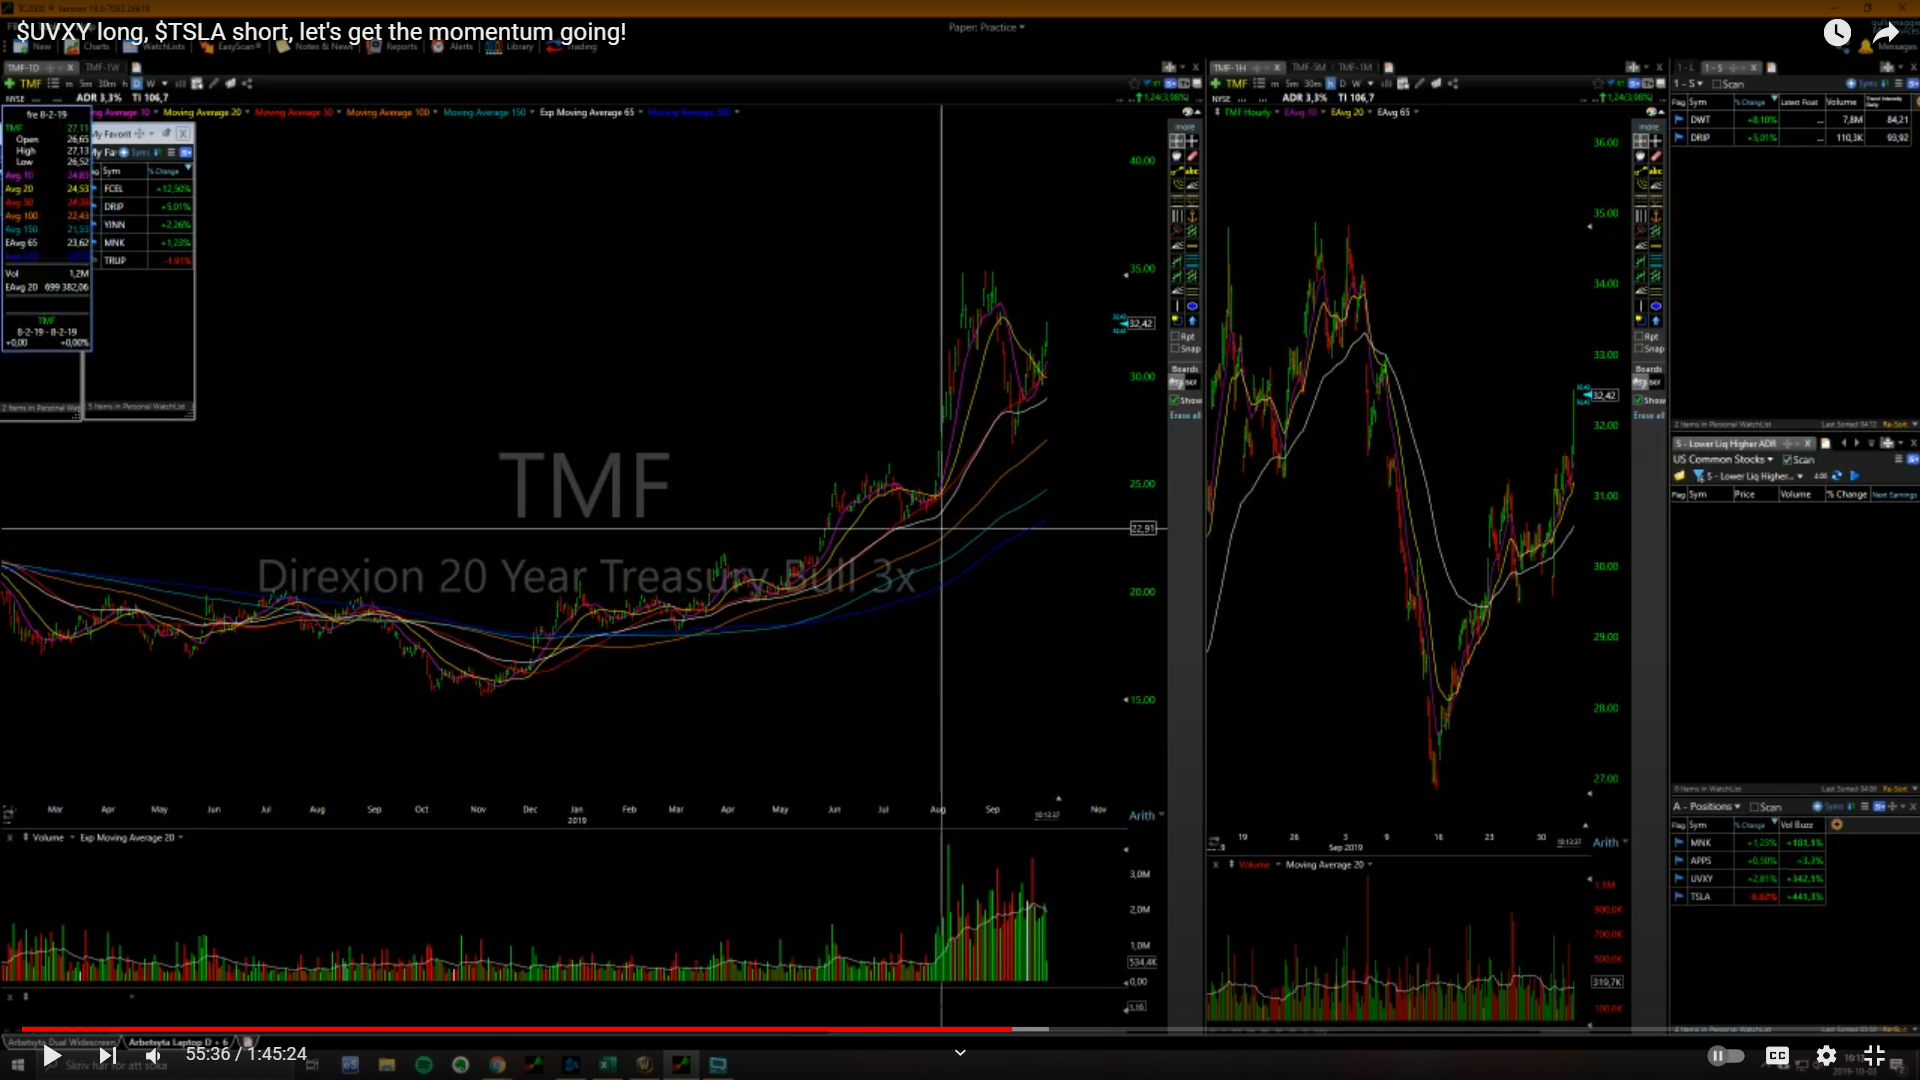
TMF these rate etfs still going higher, triple treasury etfs. Look at this breakout here this is a 5* breakout [31/7/2019] you have a big move, very linear very nice very clean move, then it just rides these MAs then a breakout on volume. Same this with TLT.
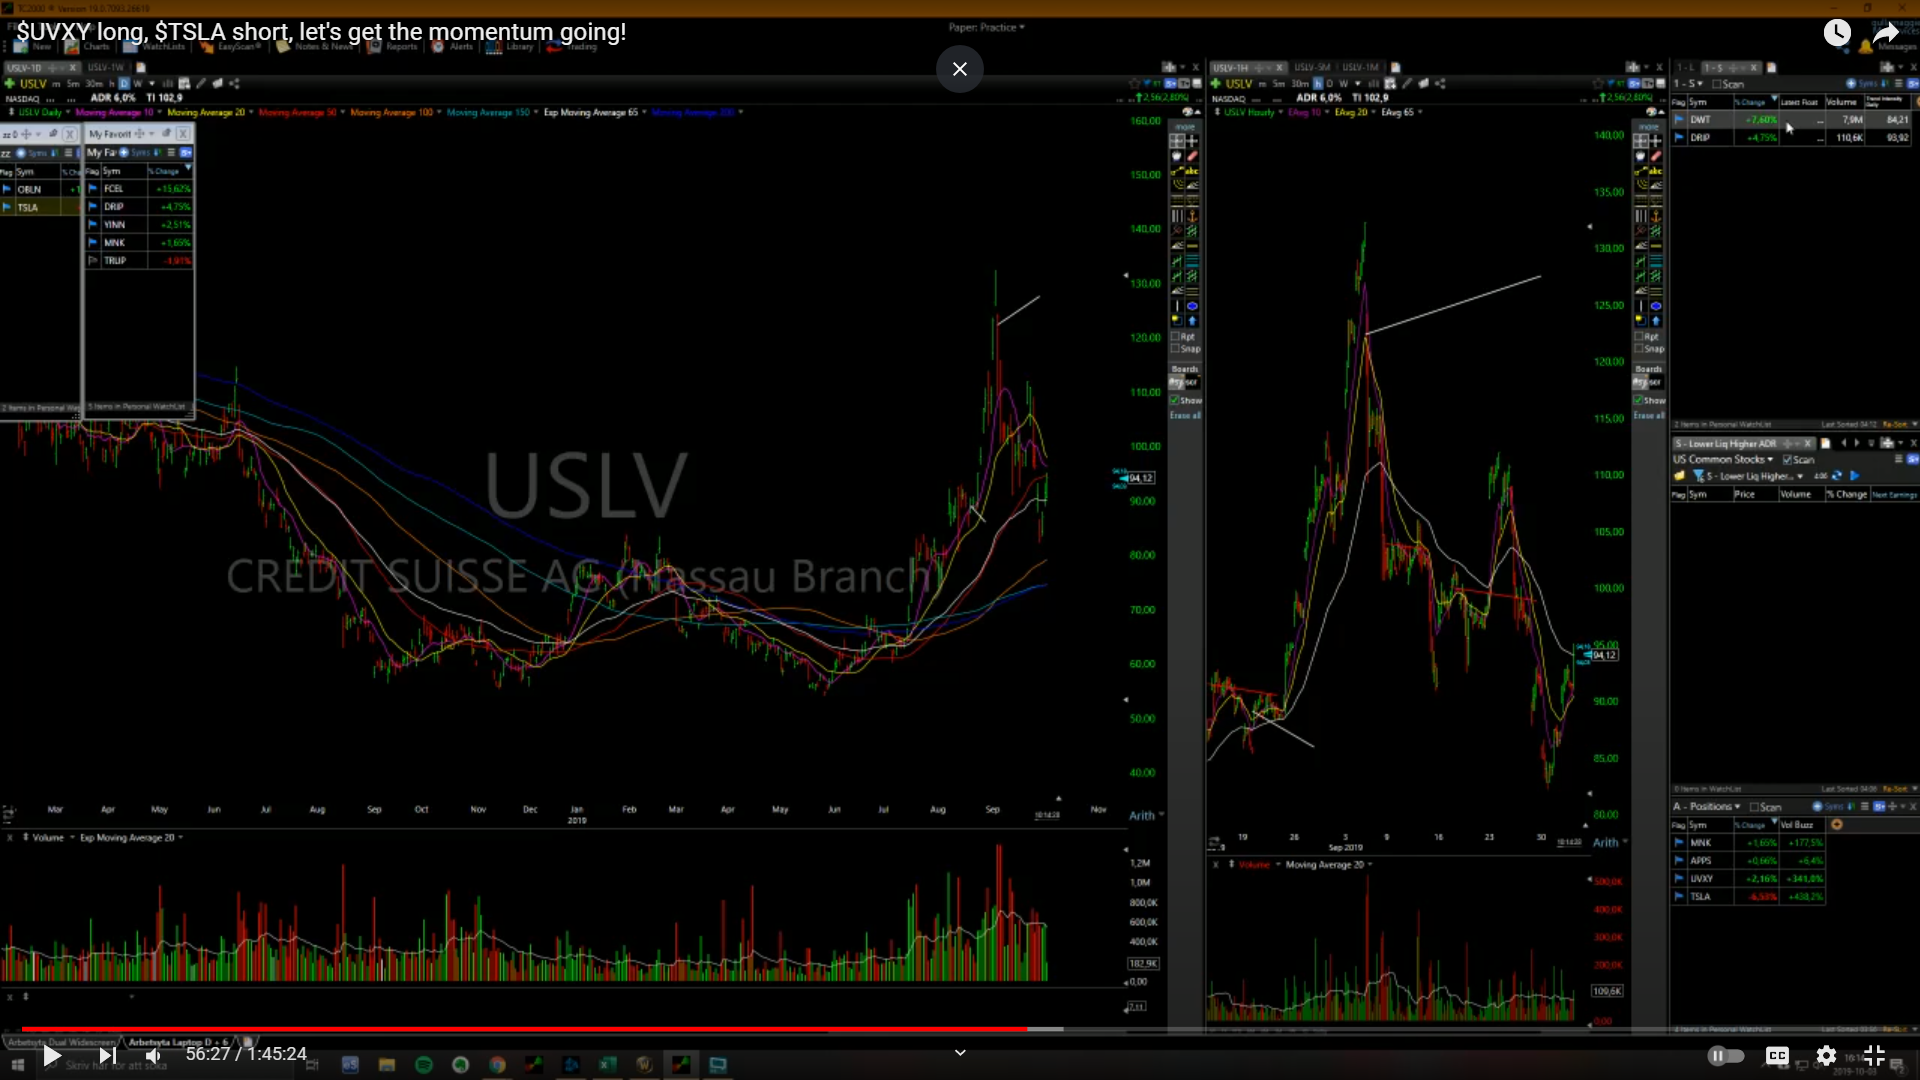
USLV another great breakout 5* then went up 40% in a few weeks, those are my favourite patterns htfs, you don’t get them that often that’s the tricky part.
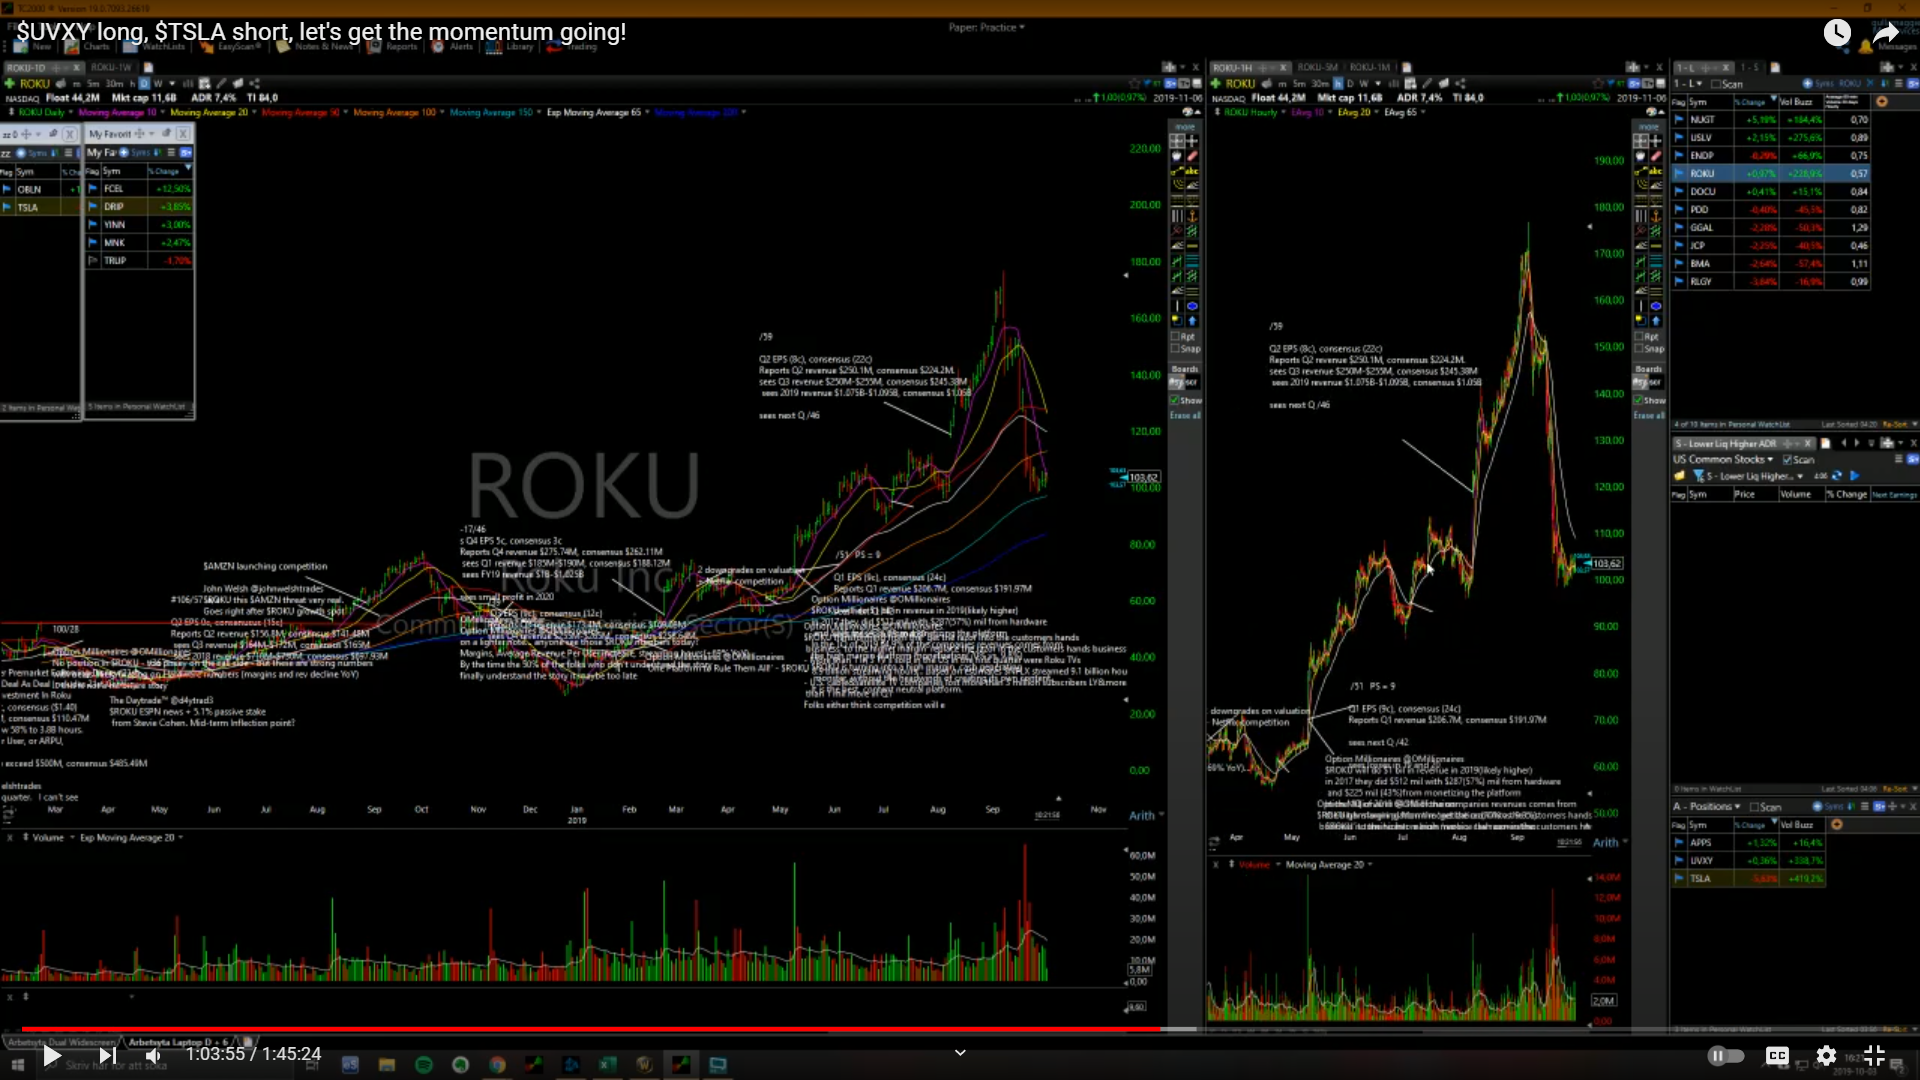
It’s hard to get big r/r trades on an intraday timeframe, hard to get a 20R trade on a daytrade but if you swing/position trade that happens all the time. Like ROKU when I bought it orhs I had a $2 risk and it went up $100, 50R, you’re not gonna have that with a daytrade, if you daytraded you’d have still done well like 6R, but that’s what I mean you need a higher winrate. You need to lock in profits faster, I usually don’t lock in my profits up 1-3R but on a daytrade you almost have to lock in some at least 1/3 or 1/2 and then raise your stops. I had a higher winrate as a daytrader definitely bc I locked in partials and I was more aggressive in moving stops.
ROKU is another of the big leaders, fast growing stock, found a bit of support here having a little bit of a rounded bottom and the range, these are the signs I look for, these leasers that have pulled back a lot and now they’re bottoming, they’re way stronger than the overall market, holding up inside of this range. You want to see these leaders starting to show resilience against the overall market, so when the market stops going down or starts going up, these stocks will go up even more. You gotta look for these signs, and just wait, waiting is such a big part of this game, like 95% of trading is waiting, looking for clues, and looking for those great opps.
DDS has been pumped as a short squeeze for a few months now on Twitter, it’s a really high short interest and the company has been buying back its own stock so the thesis is that its tradable float is really small, real easy to push it up, idk, why can’t this thing double if it’s true and the pump gets going?
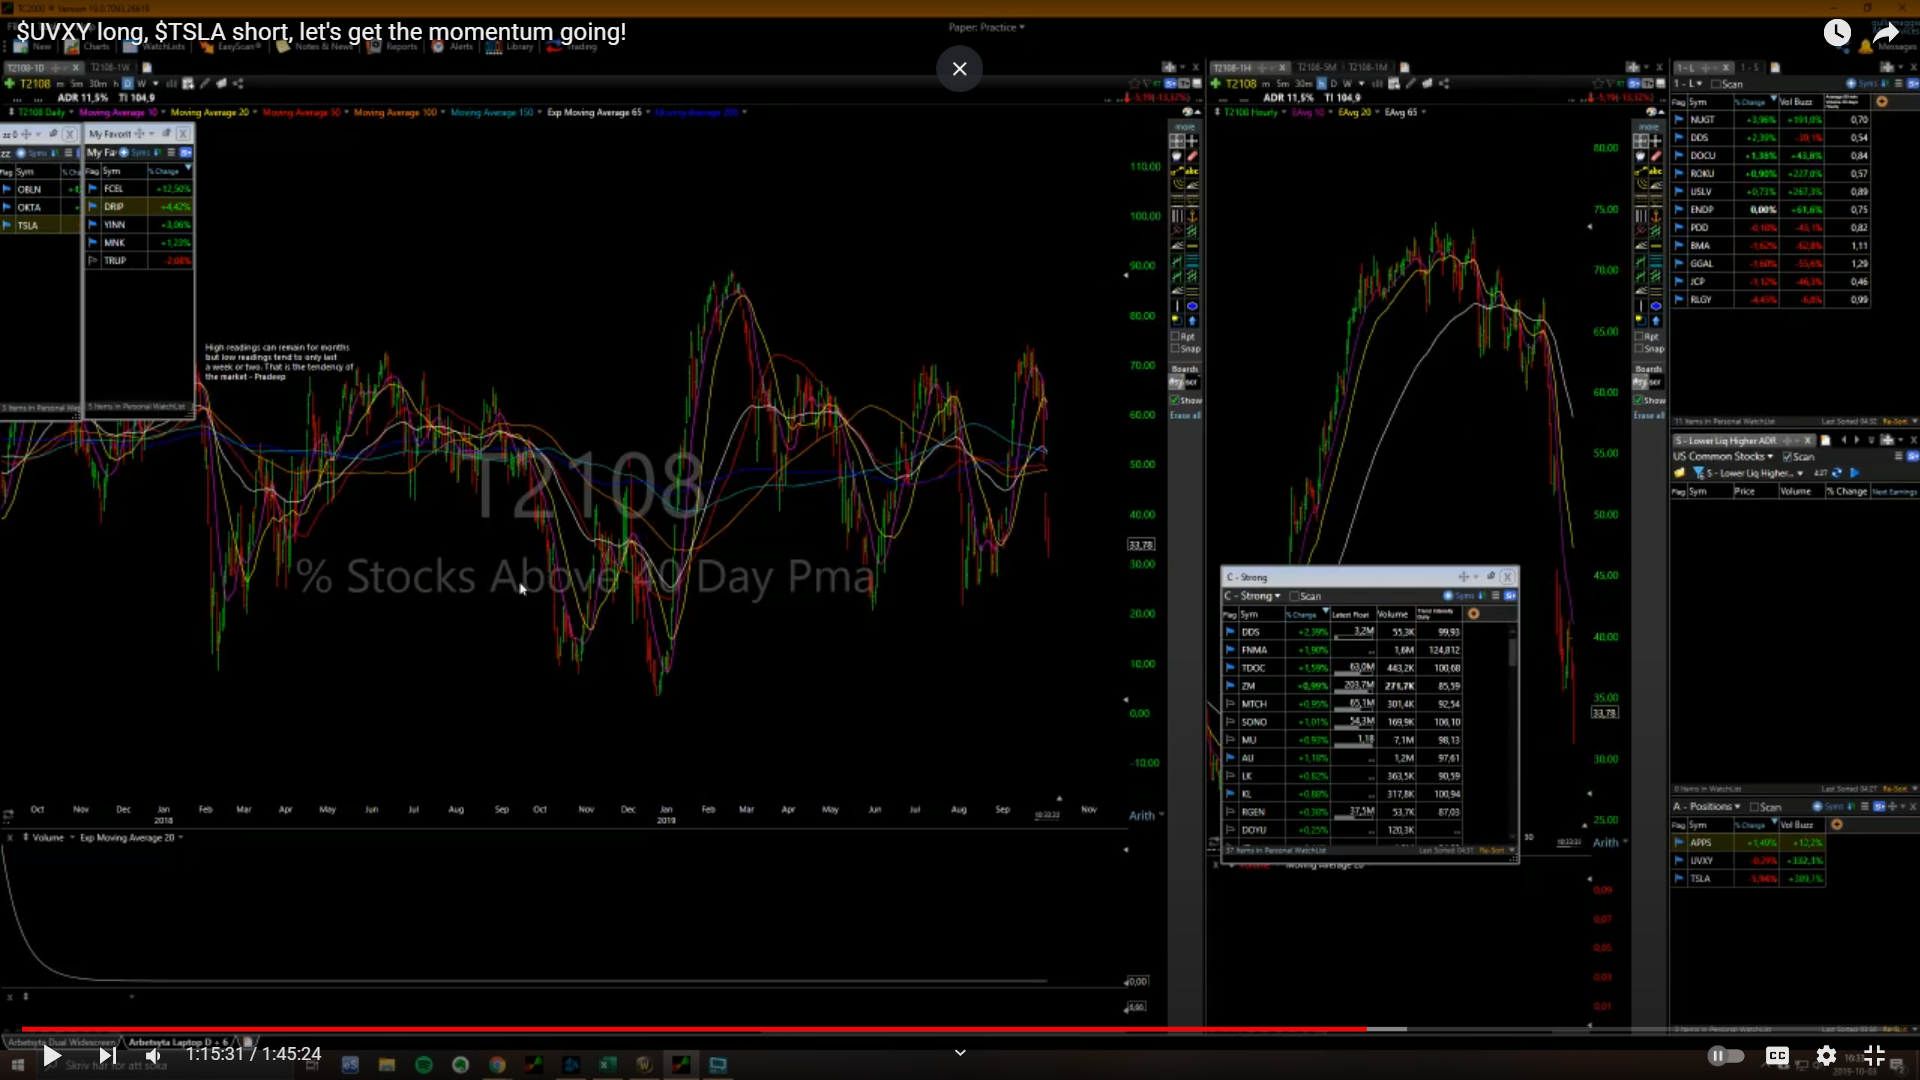
T2108 shows stocks above the 40day, like if you look at SPYs or IWM Oct-Dec2018 retrace you see as the market continued lower the number of stocks below the 40day didn’t really increase that much, so you can look at divergences stuff like that, and after a big rally you can see when this thing starts rolling over that’s also a good way I use to decrease my exposure if I’ve heavily long after a big move up, a big multi week/multi month run. I also look at NAMO same principals really, NASI is the NYSE McClellan pretty much the same thing when it’s been going down for a while and starts turning higher, or going up for a while and starts turning lower, these are also great times to increase or lower your exposure. CPCE also is put/call correlation, when it gets extreme either side many times it’s near a short term top or bottom. I don’t look at these things every day but I usually look at them once or week or so just to see, it’s good to be aware what’s going on in the markets under the surface.
Watchlists it’s a combination of fundamentals and momo; strong, stronger, strongest. Then I have a strongerest scan that scans these three watchlists where the criteria is pretty much it has to be above yday highs, up 1% on the day. And I find ideas from these gainer scans, the strongest 3-4% stocks in the US markets that are liquid. Then I look up the numbers very quickly in Marketsmith, the best ones for me over the years are stocks that have big growth and big estimates, I like to combine fundamentals and momo.
For trading you don’t have to look at insider buys and sells, unless it’s like a microcap and a lot of insiders start buying meaningful stakes, especially if it’s a biotech, but you don’t get that many scenarios per year.

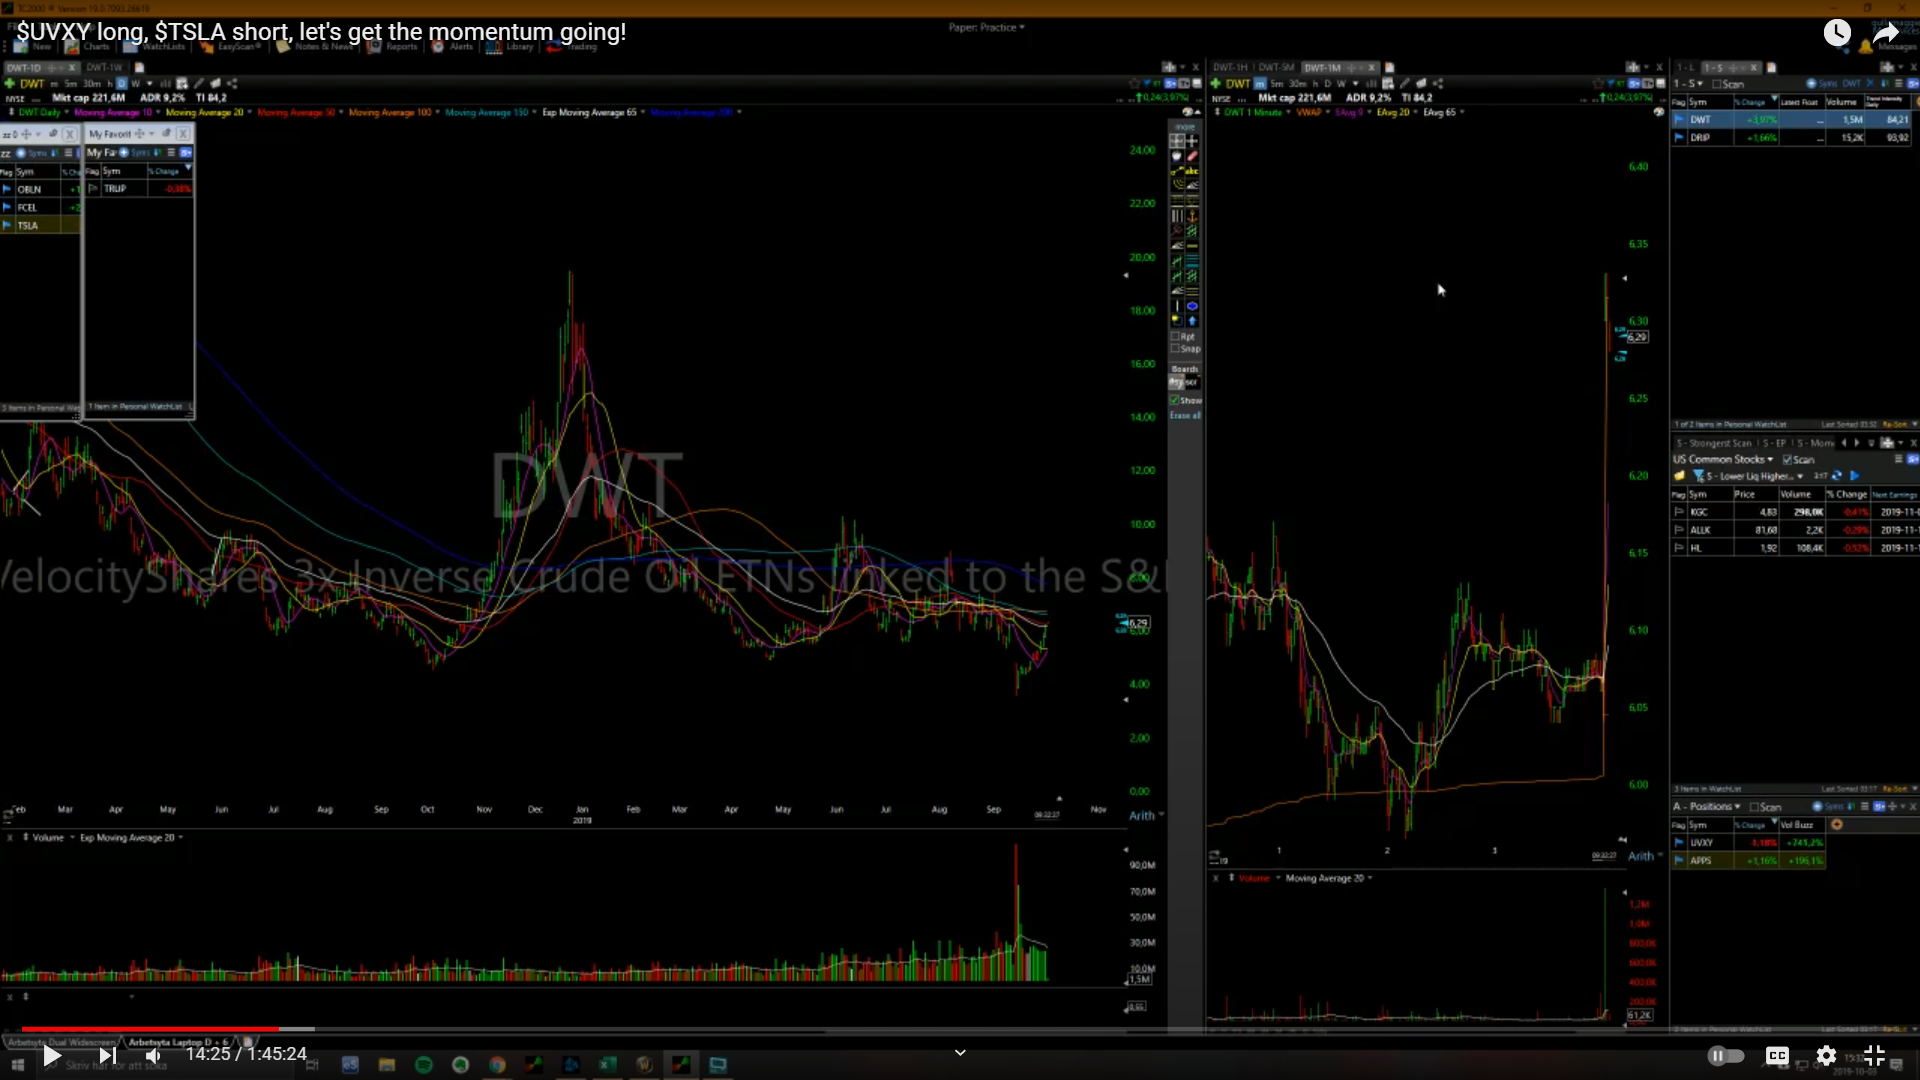 Htb, I missed my entry. Shorted some DRIP instead. I’m risking $2.5 with slippage but if it goes down could go $10/15, it’s been straight up for two weeks.
 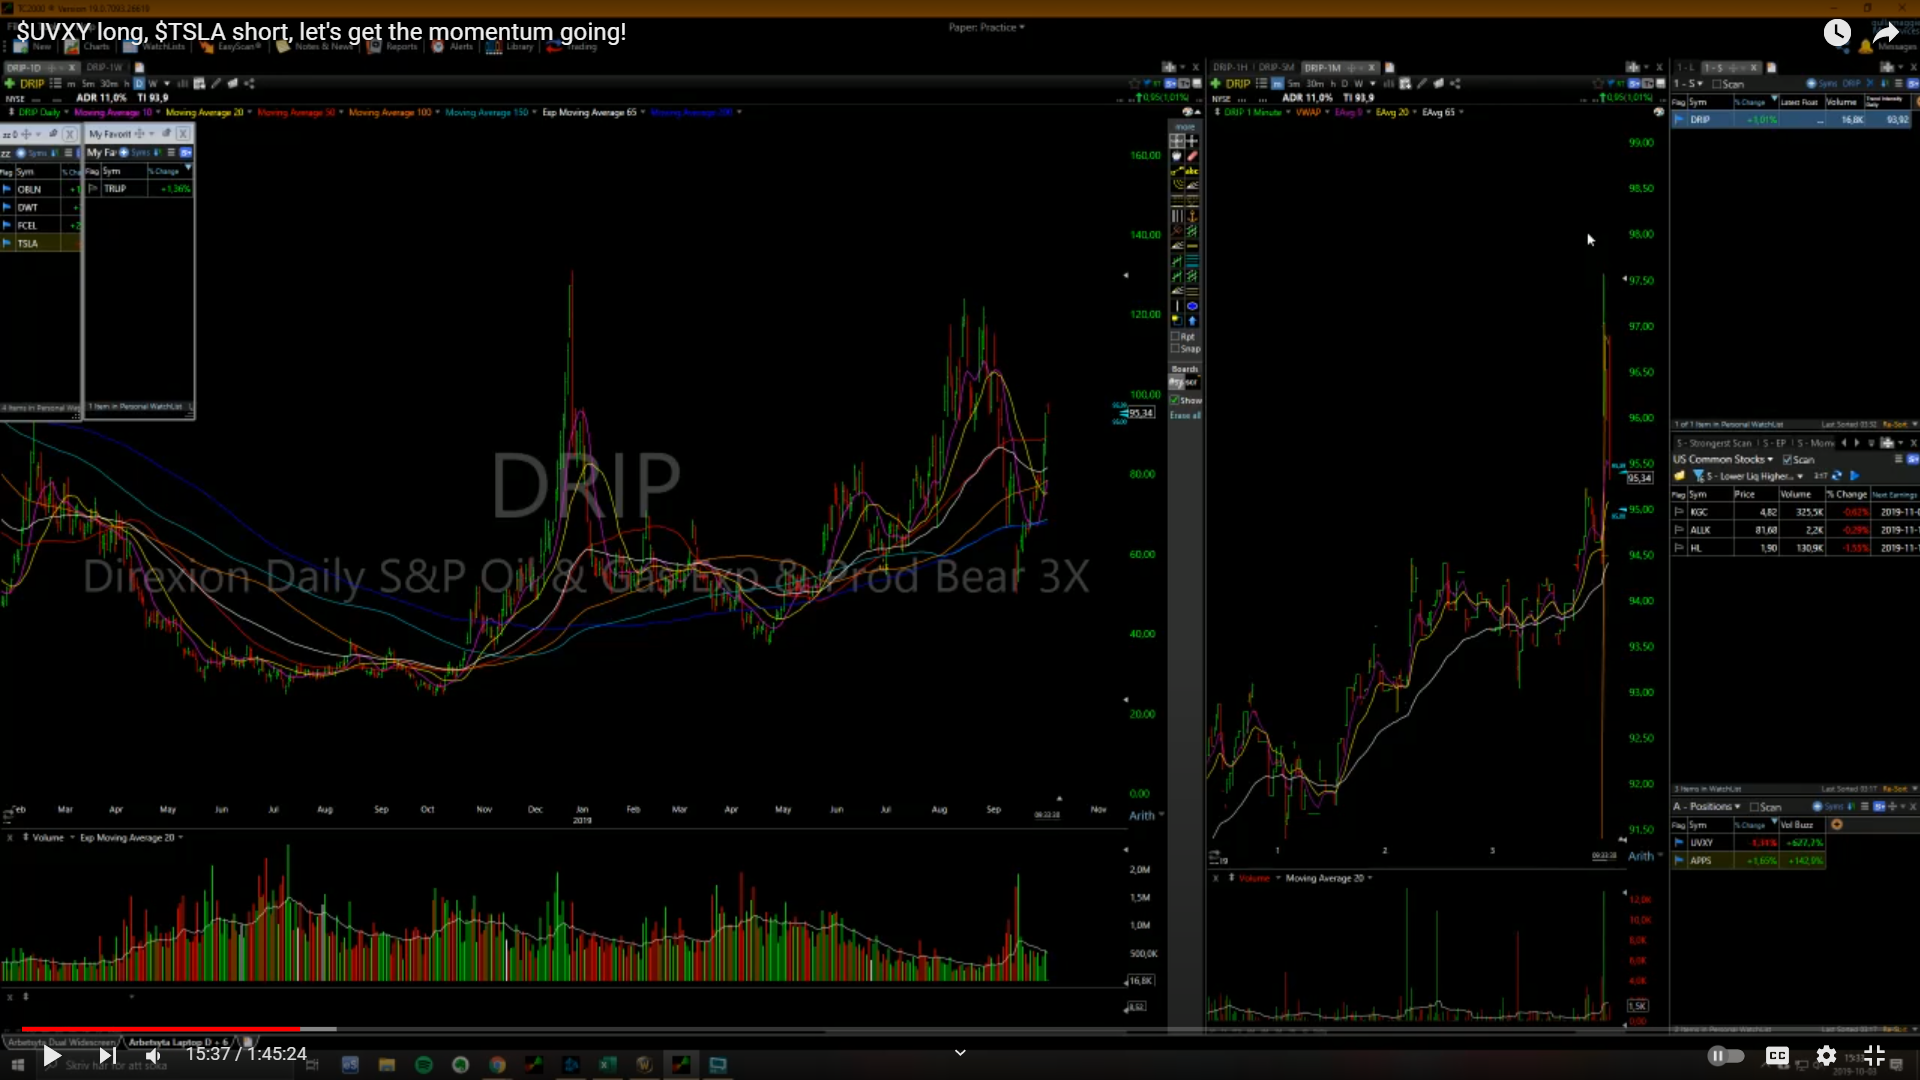 Stopped out, woa must have been some oil news. Good thing I got stopped out bc now we’ll get an even better setup, ideal scenario it goes up a lot today stays strong then tomos we get a gap up. If we get a good setup I’ll short again today, but there’s no way I’m shorting now into strength, I want to see some kind of lhs or a rangebreak to the downside if I’m gonna short today. USO look at this oil how it’s down.
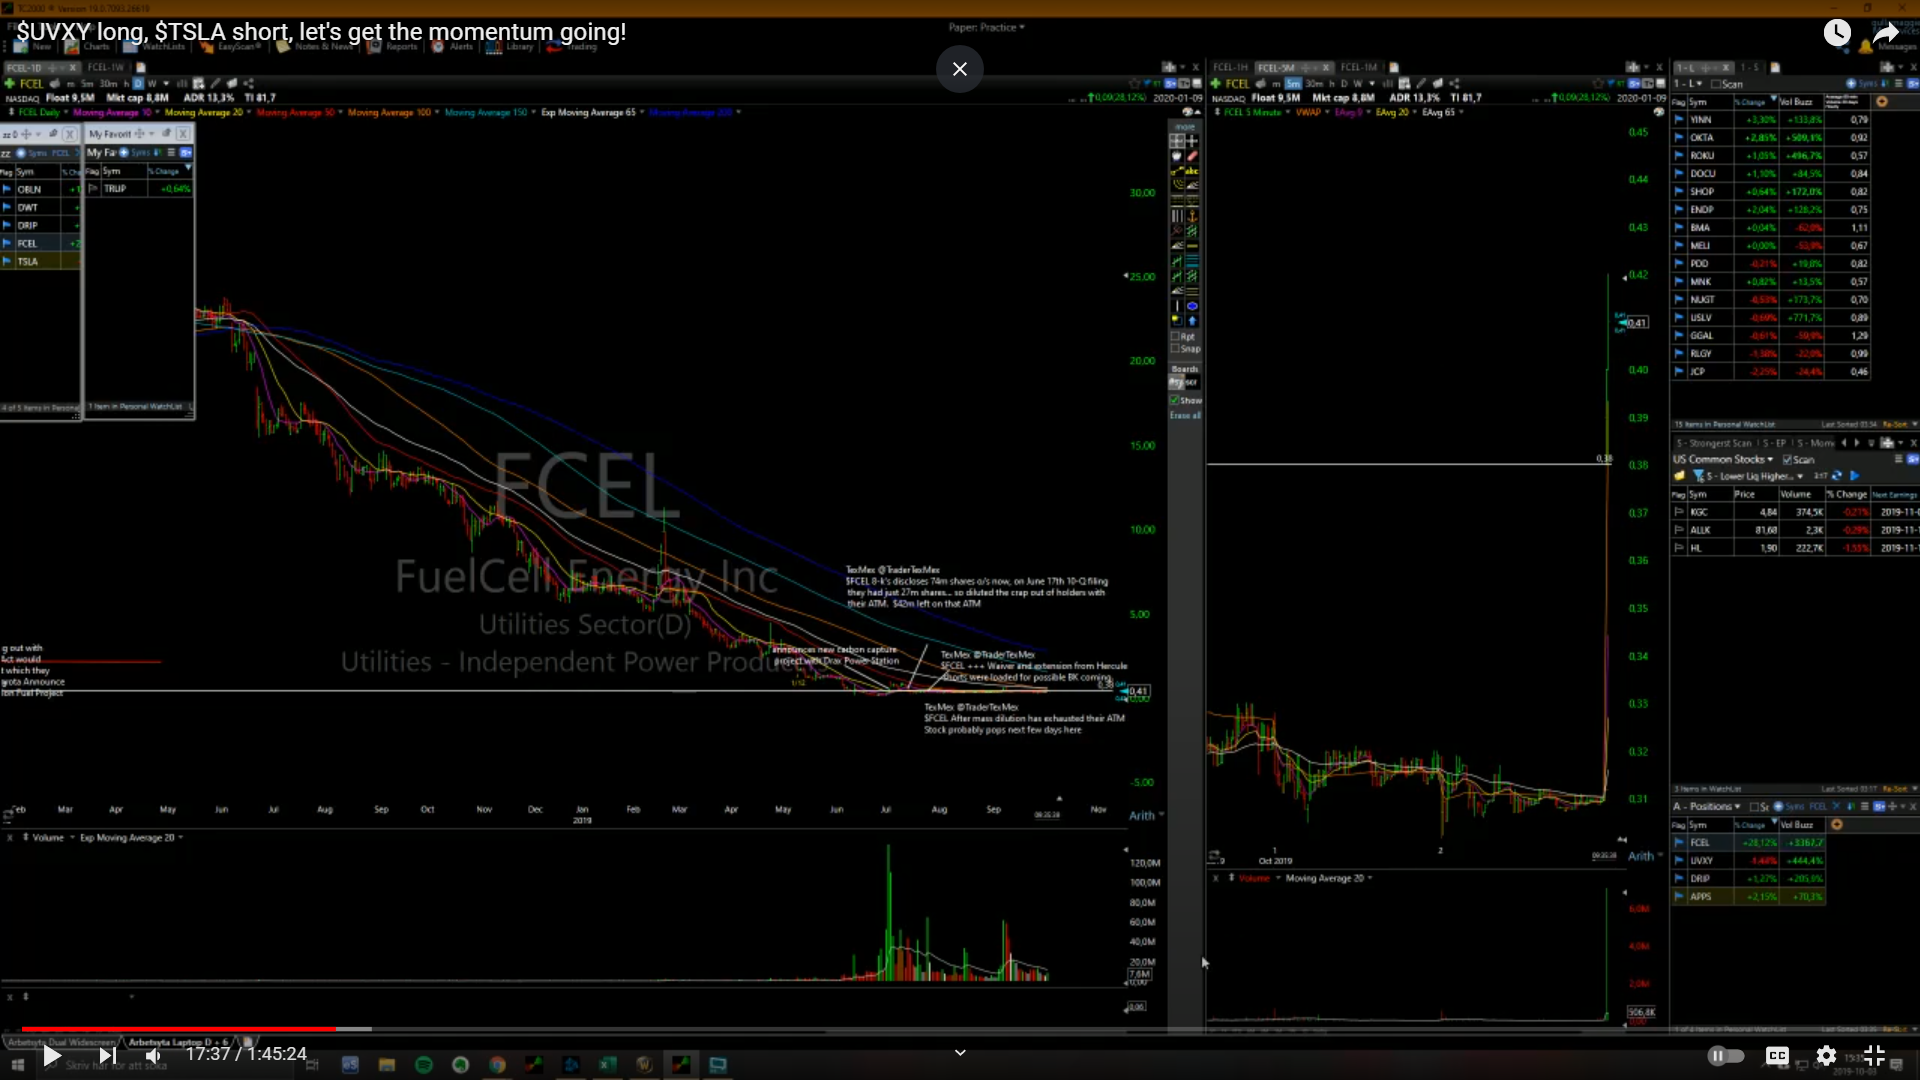 If it breaks hods I’m prob gonna buy another 100kshares considering the high volume, but prob gonna get stopped out, yep just got stopped out.
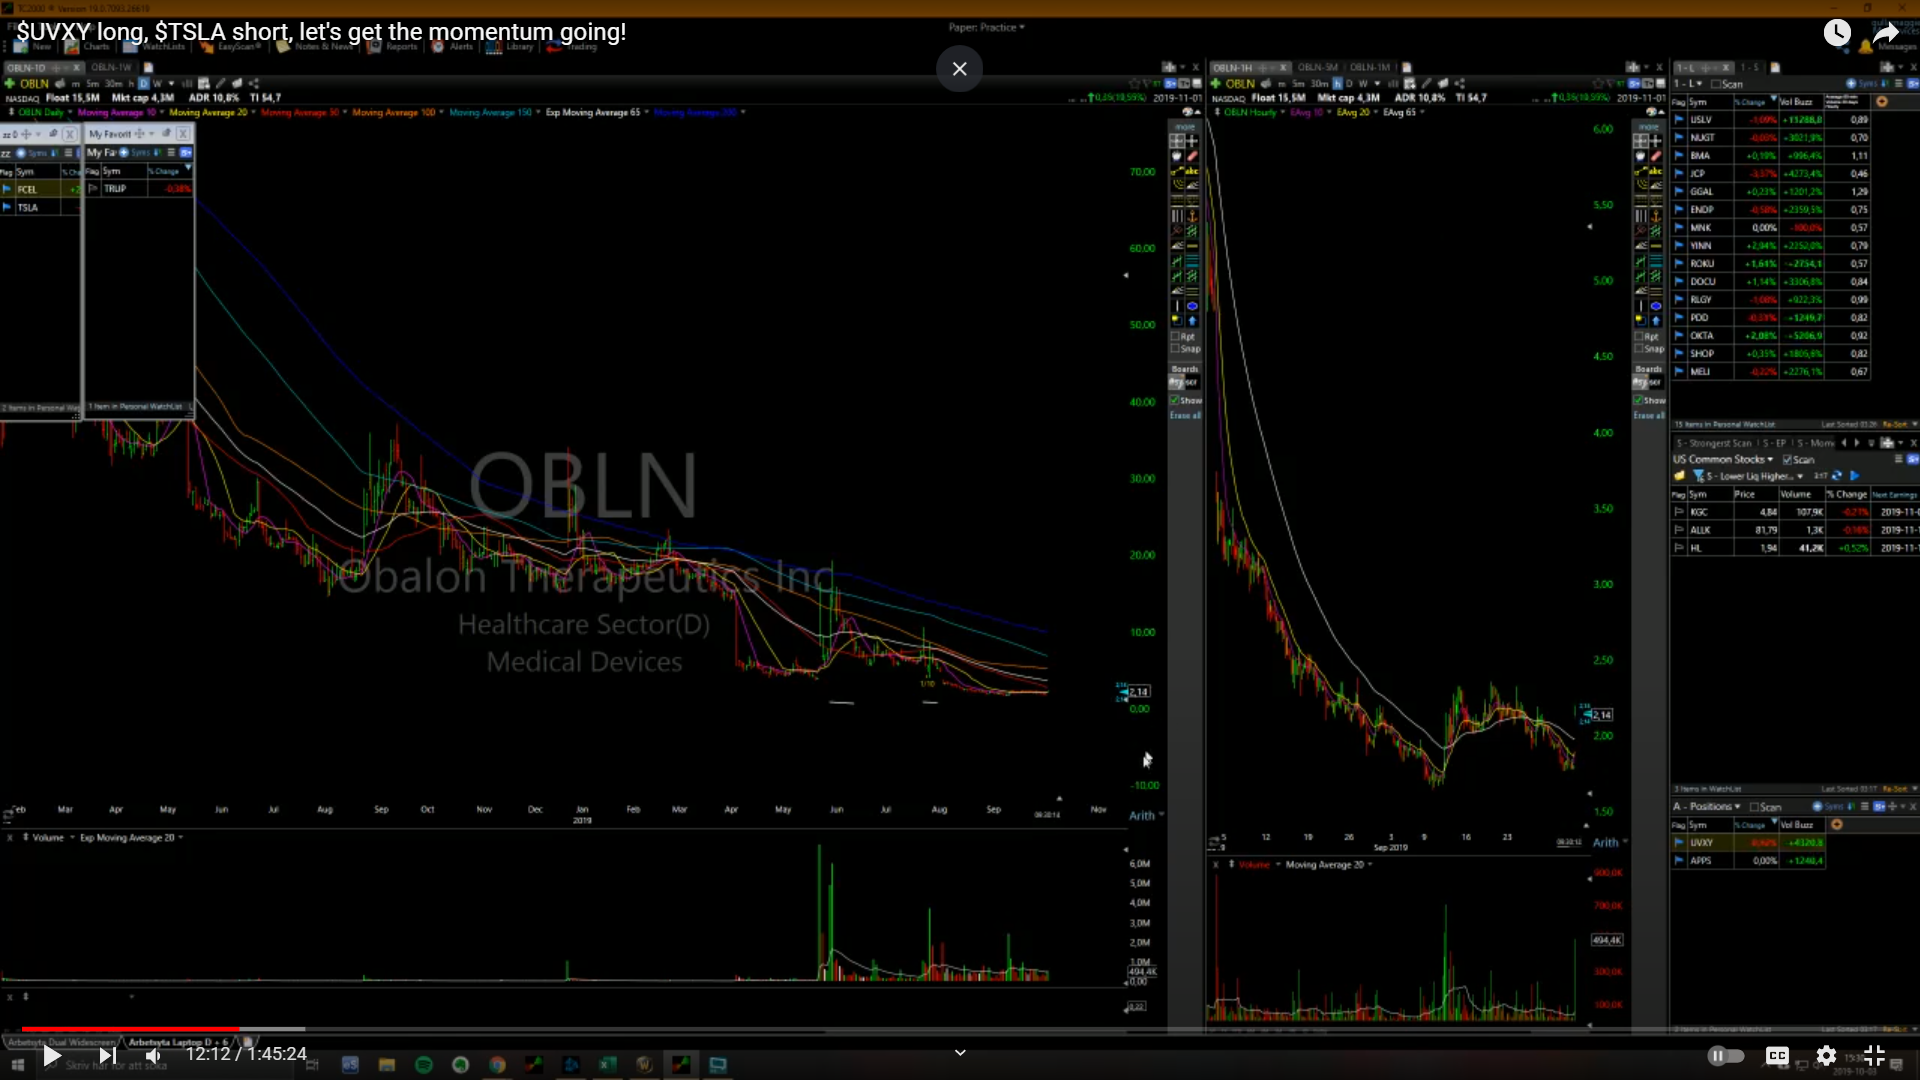
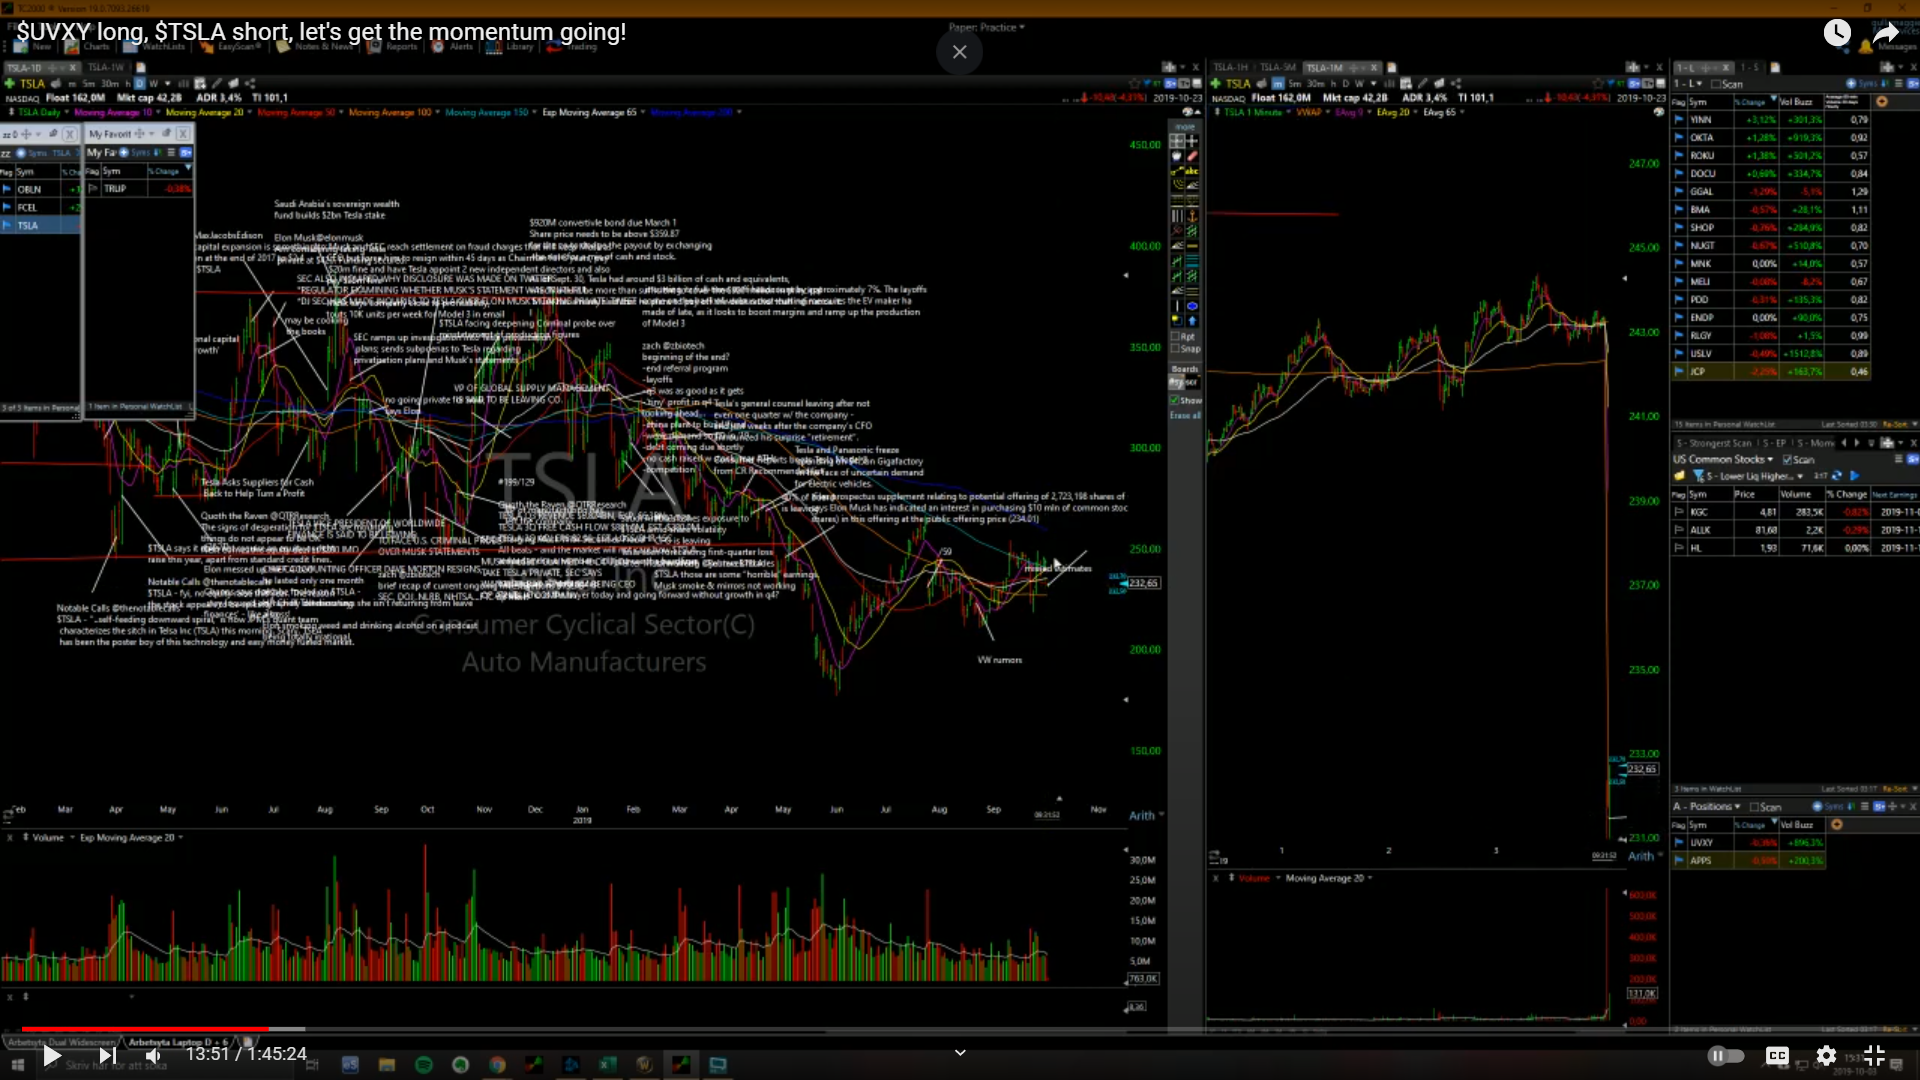 I did some small TSLA 2kshares, I wanted 3kshares but I missed the entry, I’m in from a dollar lower than where my entry should have been.
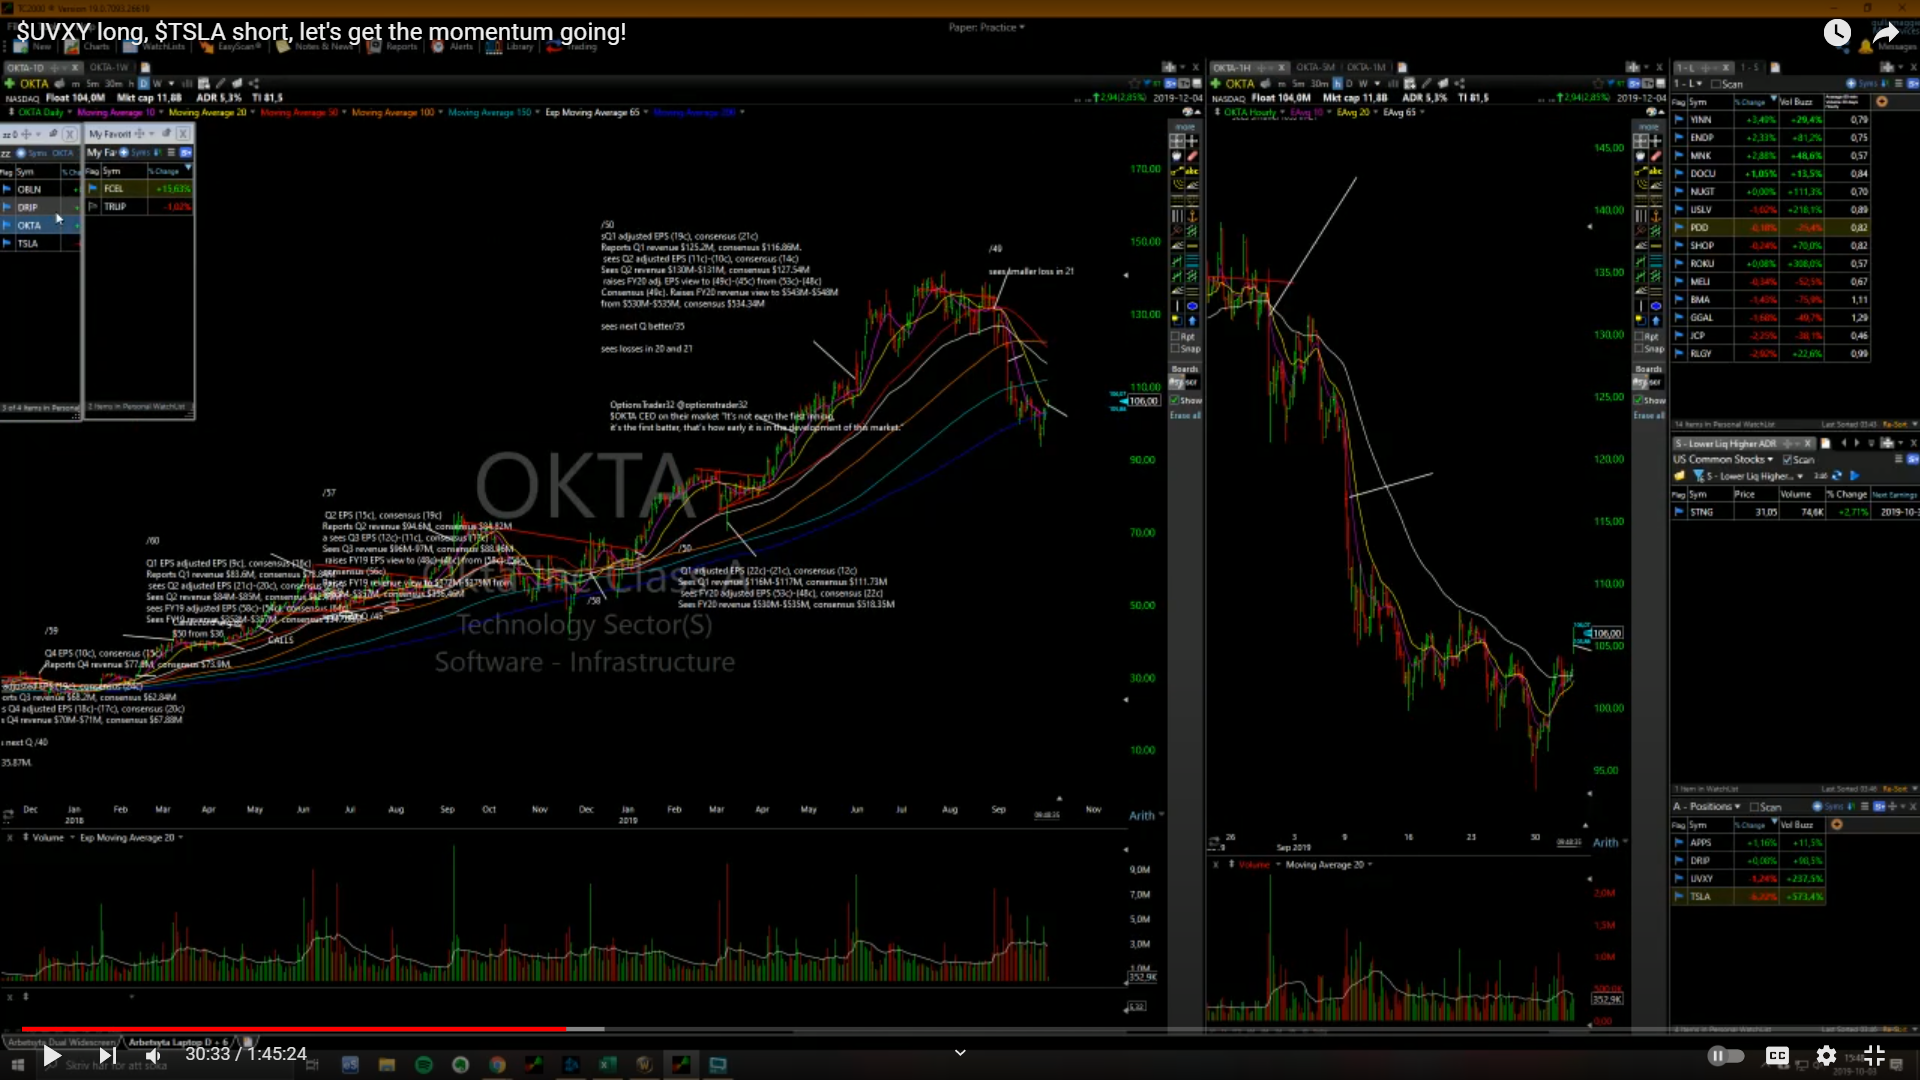
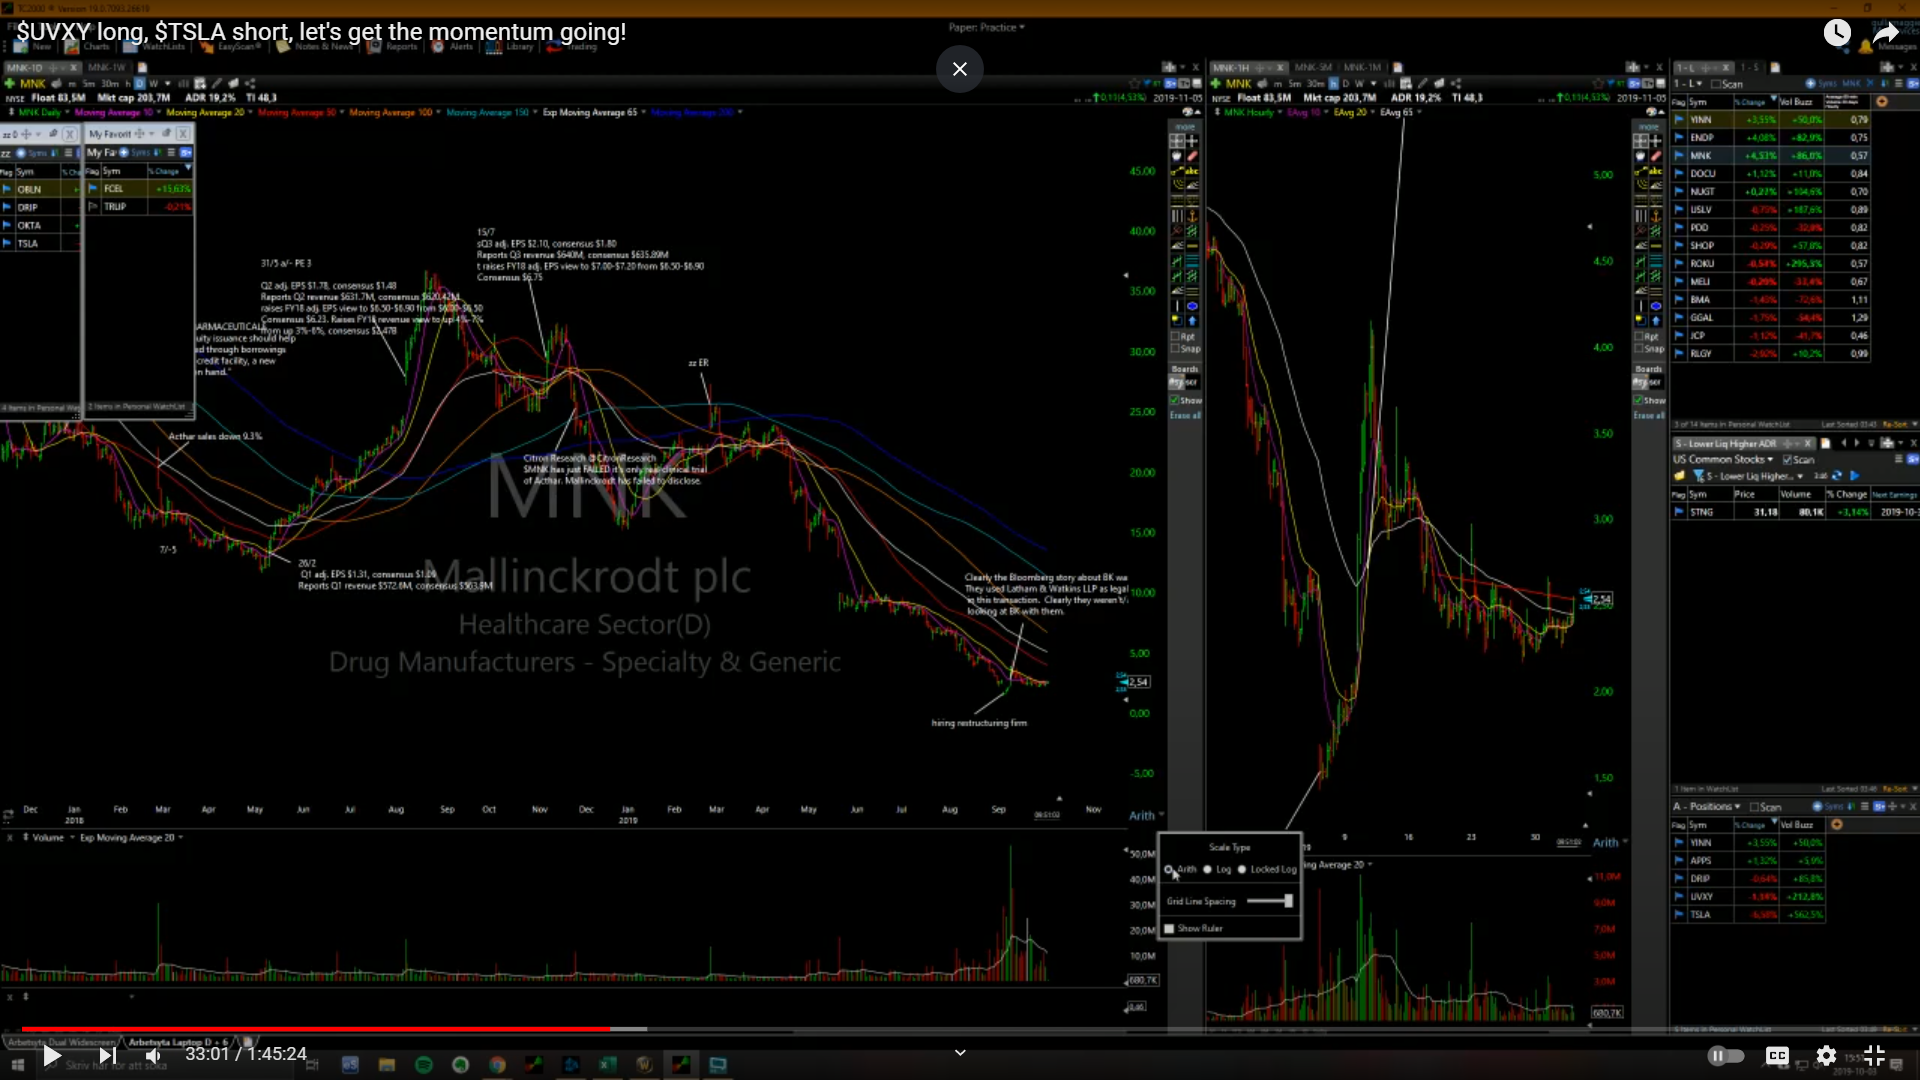 These small cap names don’t care about the market, when they go they go. It kinda looks like it coiling here, if you see put in a bit of a rounded bottom with hls. These beaten down stocks can make huge moves even though their fundamentals suck, just bc they get over priced to the downside, then funds realise like this is really cheap then they go up a lot. I bought this breakout here [Jun2018] nice little breakout perfect looking flag, hls all the way got a range.
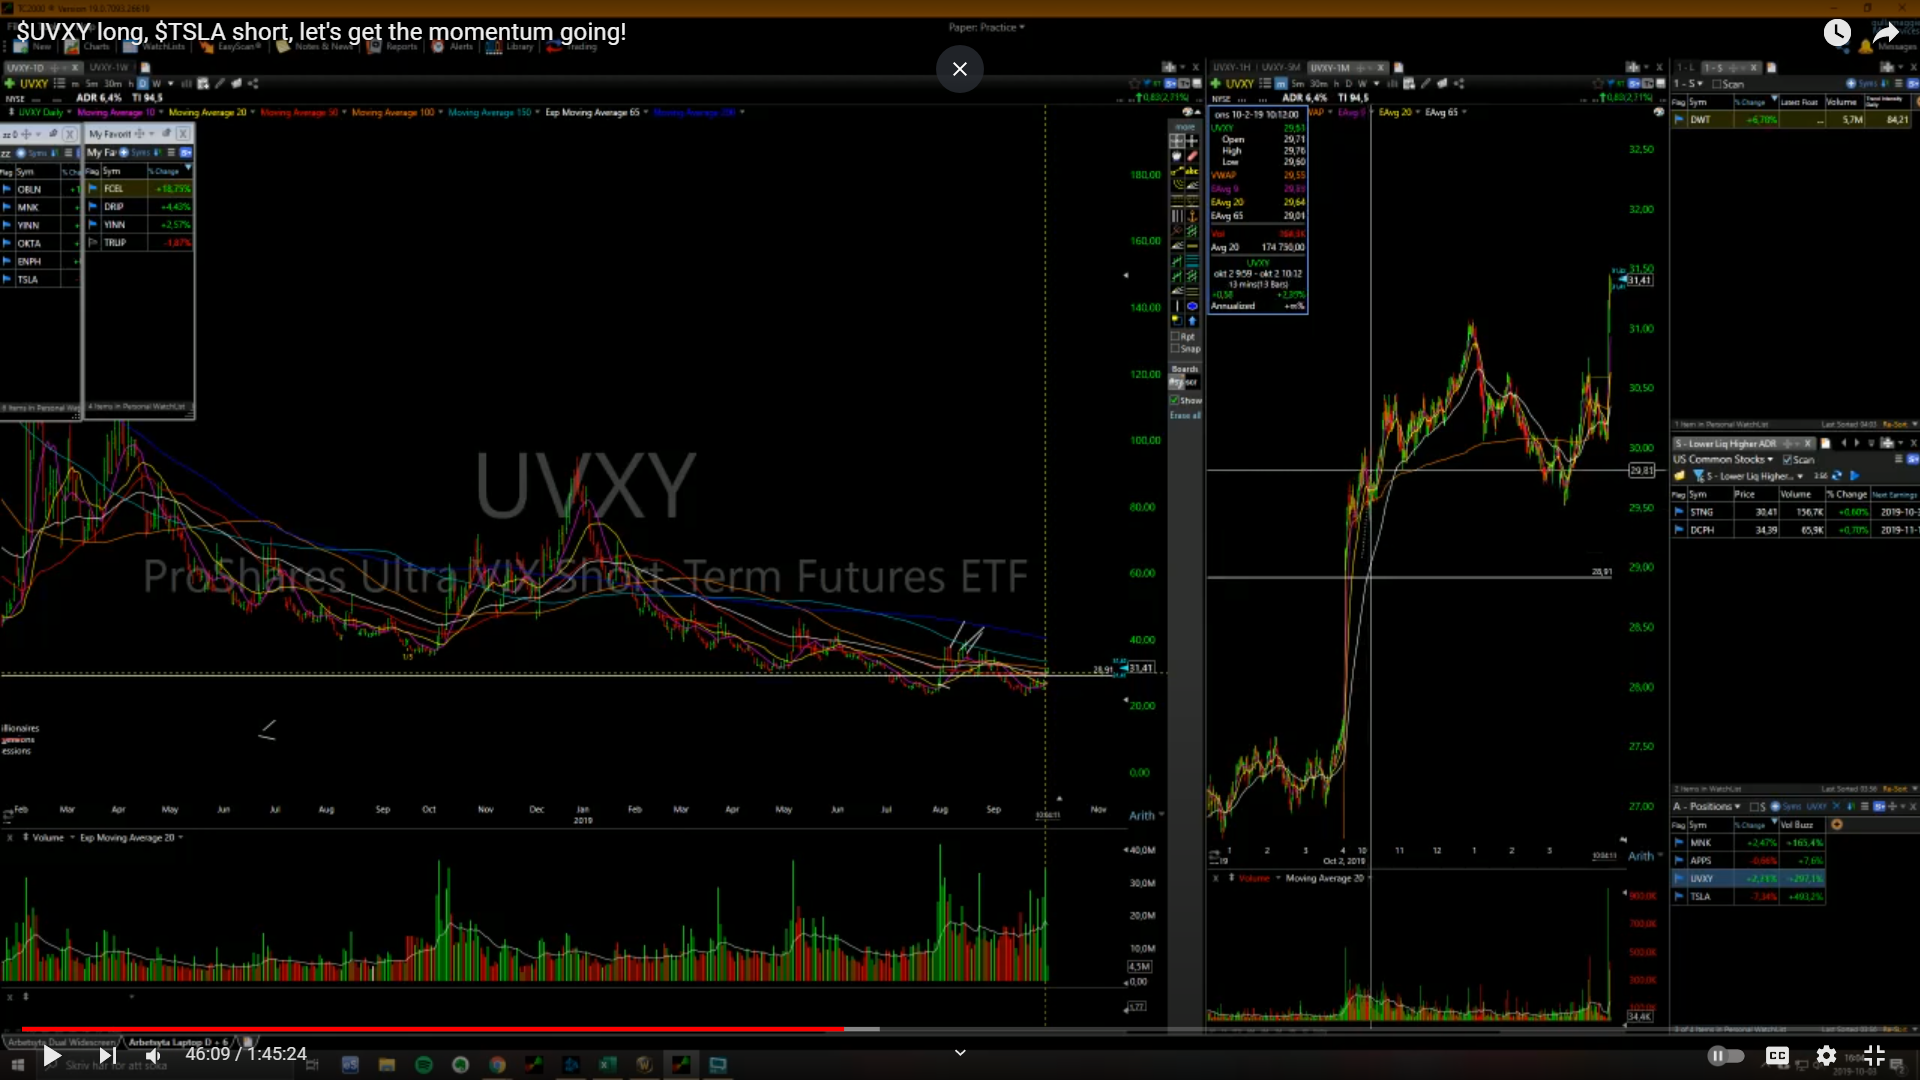
 Same this with TLT.
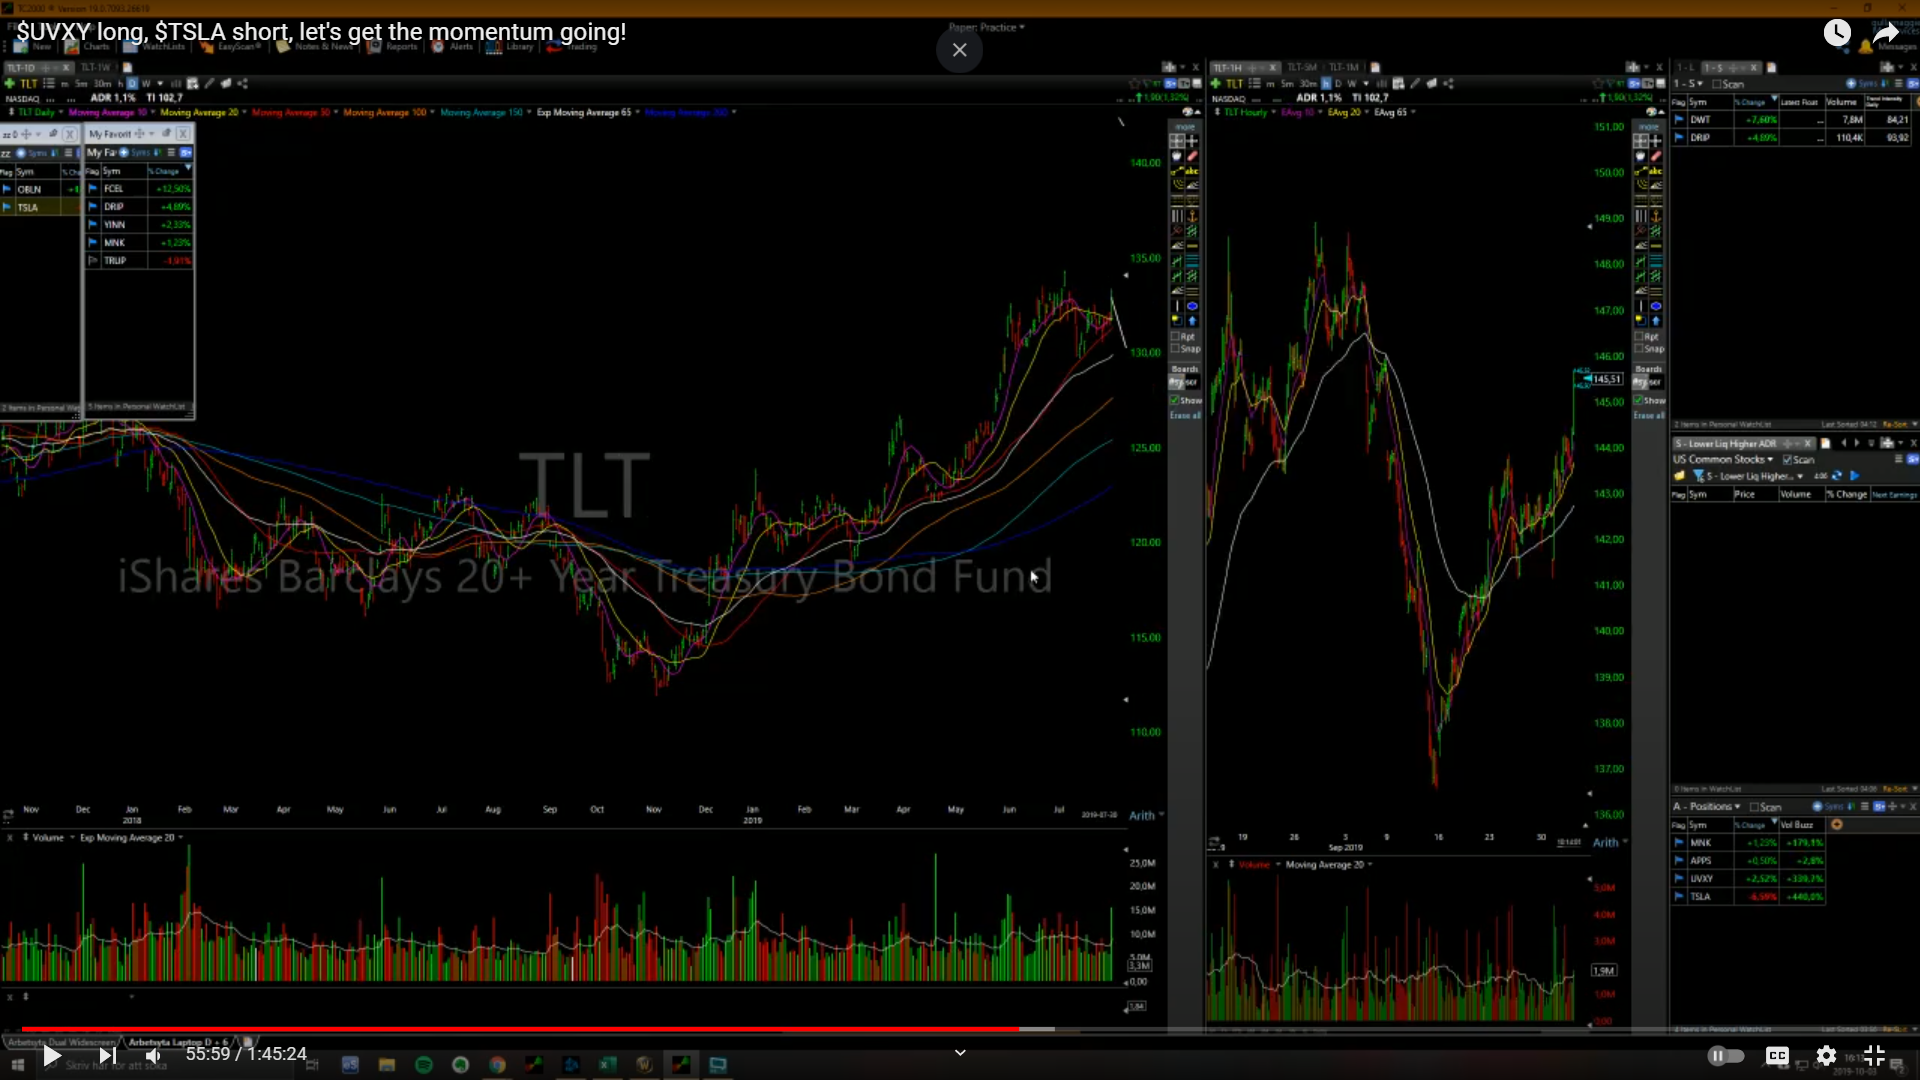
 these are the signs I look for, these leasers that have pulled back a lot and now they’re bottoming, they’re way stronger than the overall market, holding up inside of this range. You want to see these leaders starting to show resilience against the overall market, so when the market stops going down or starts going up, these stocks will go up even more. You gotta look for these signs, and just wait, waiting is such a big part of this game, like 95% of trading is waiting, looking for clues, and looking for those great opps.
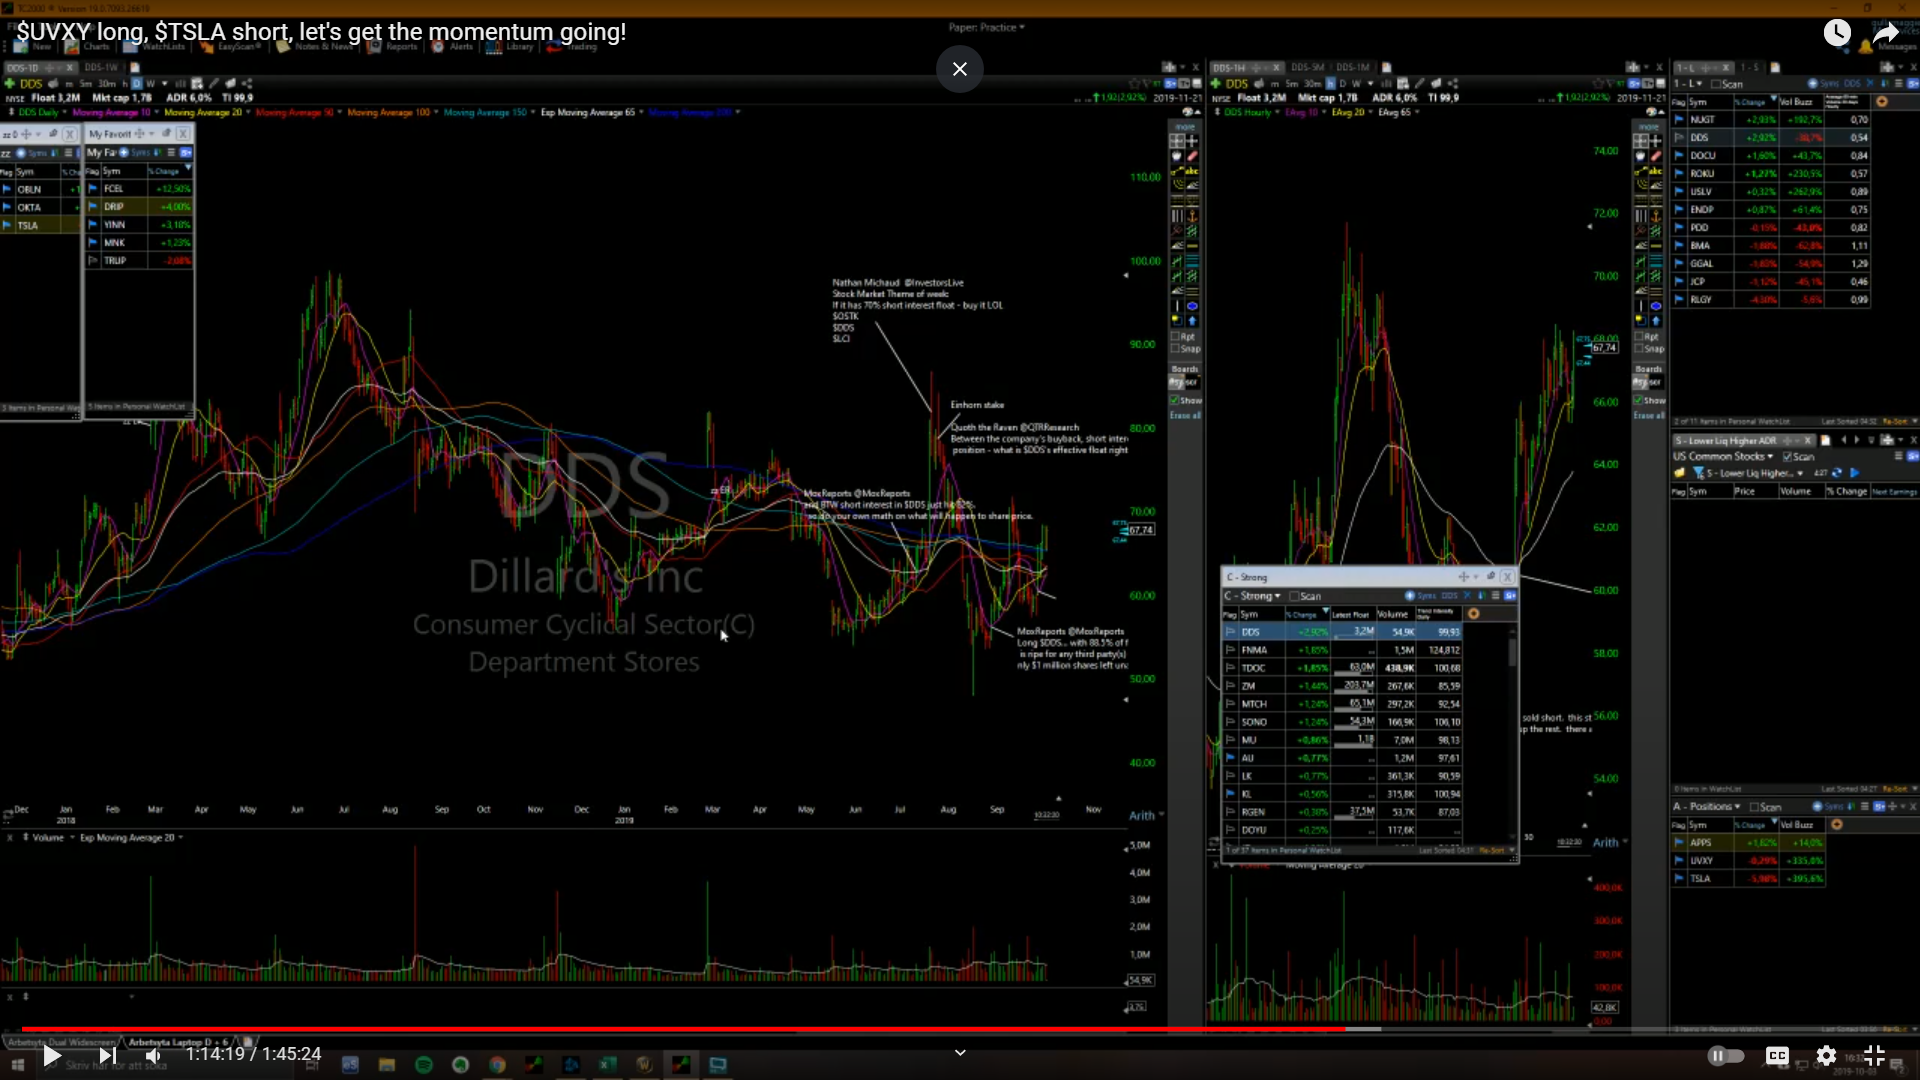
 I also look at NAMO same principals really,
 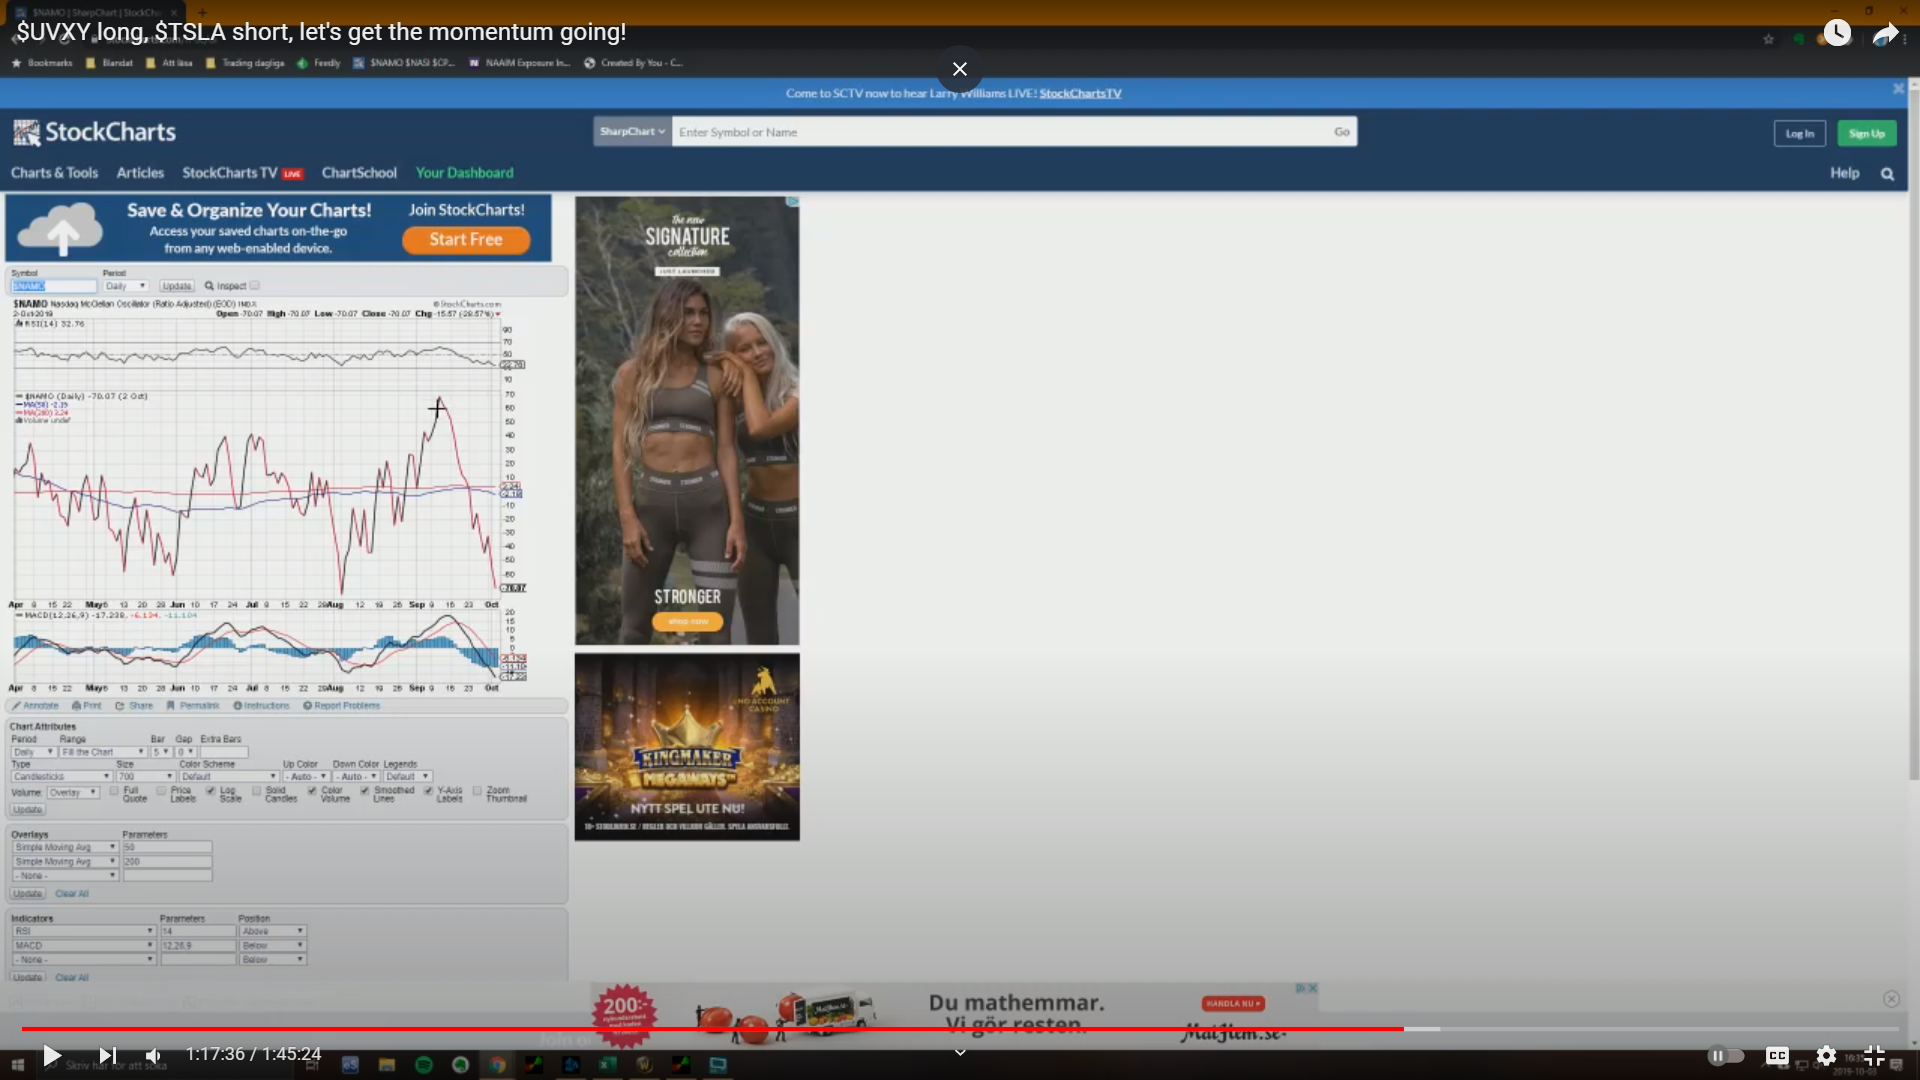 NASI is the NYSE McClellan pretty much the same thing when it’s been going down for a while and starts turning higher, or going up for a while and starts turning lower, these are also great times to increase or lower your exposure.
 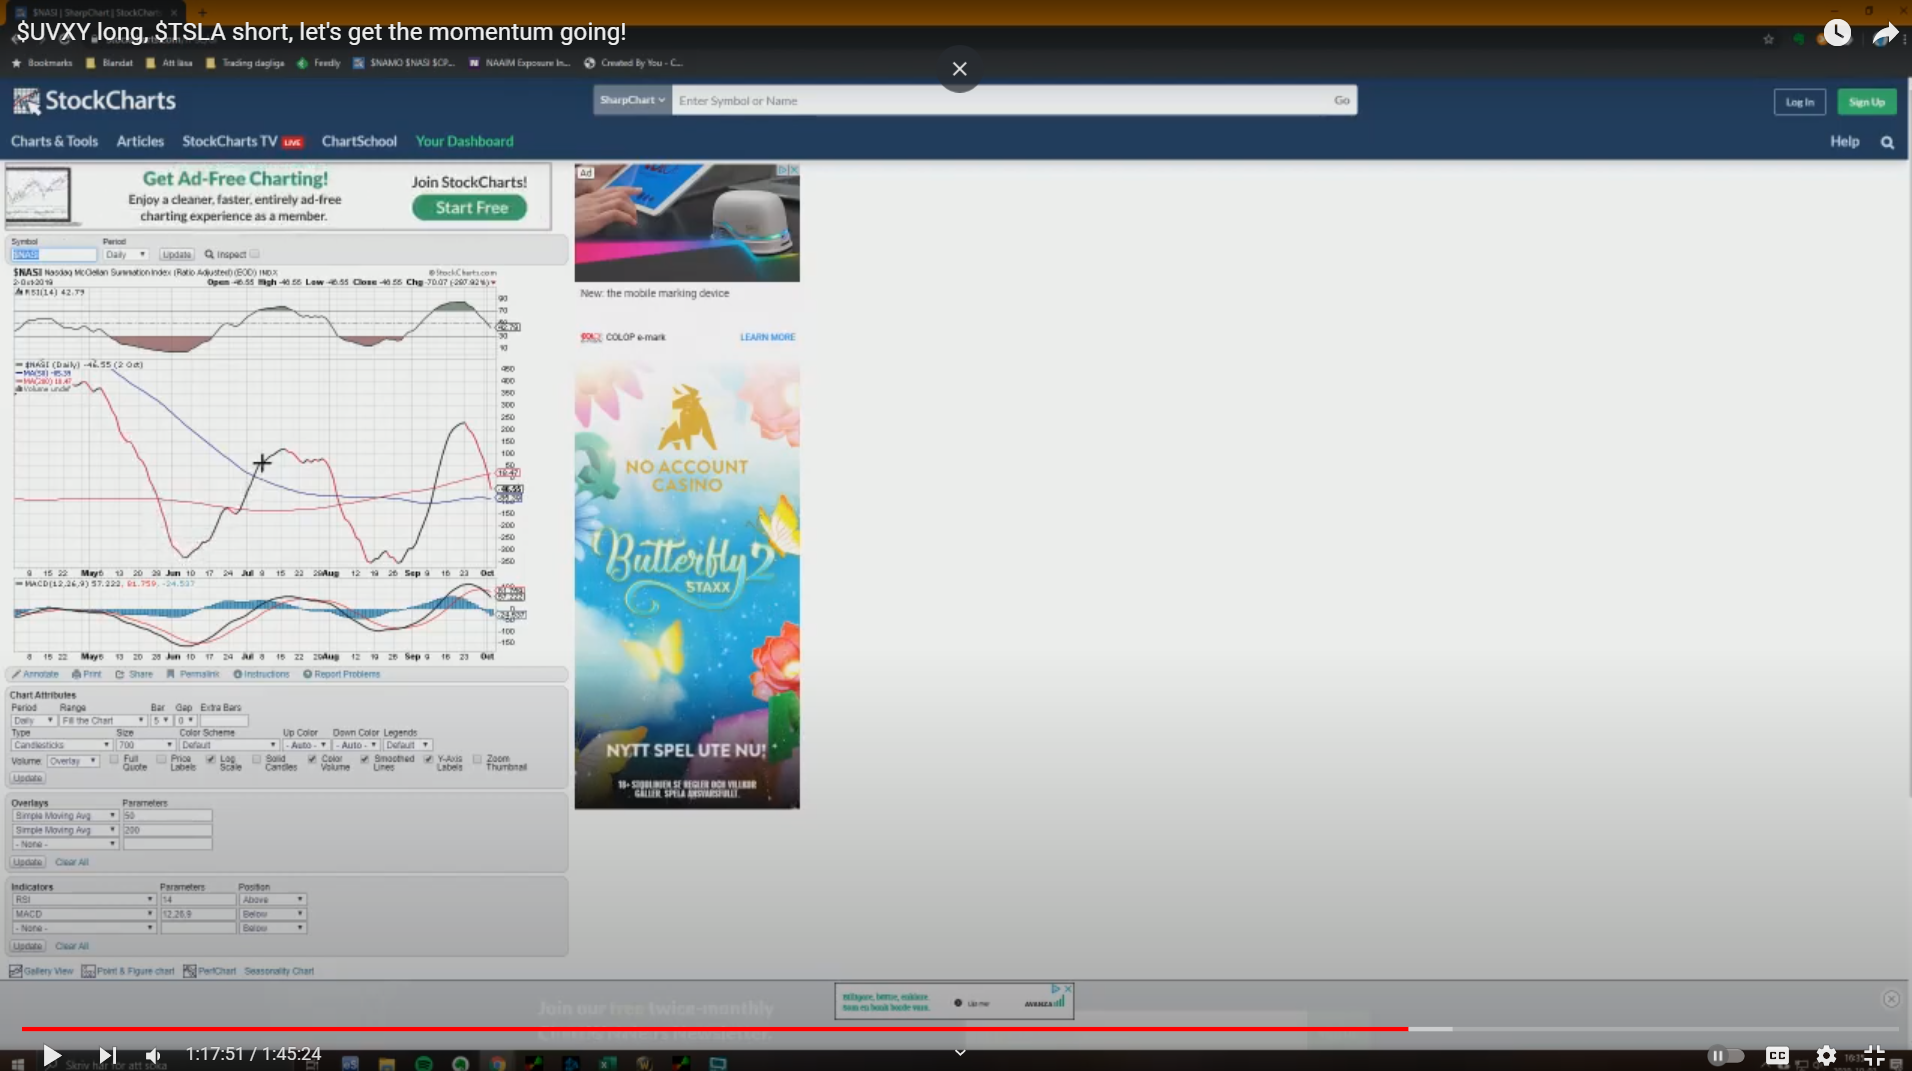 CPCE also is put/call correlation, when it gets extreme either side many times it’s near a short term top or bottom.
 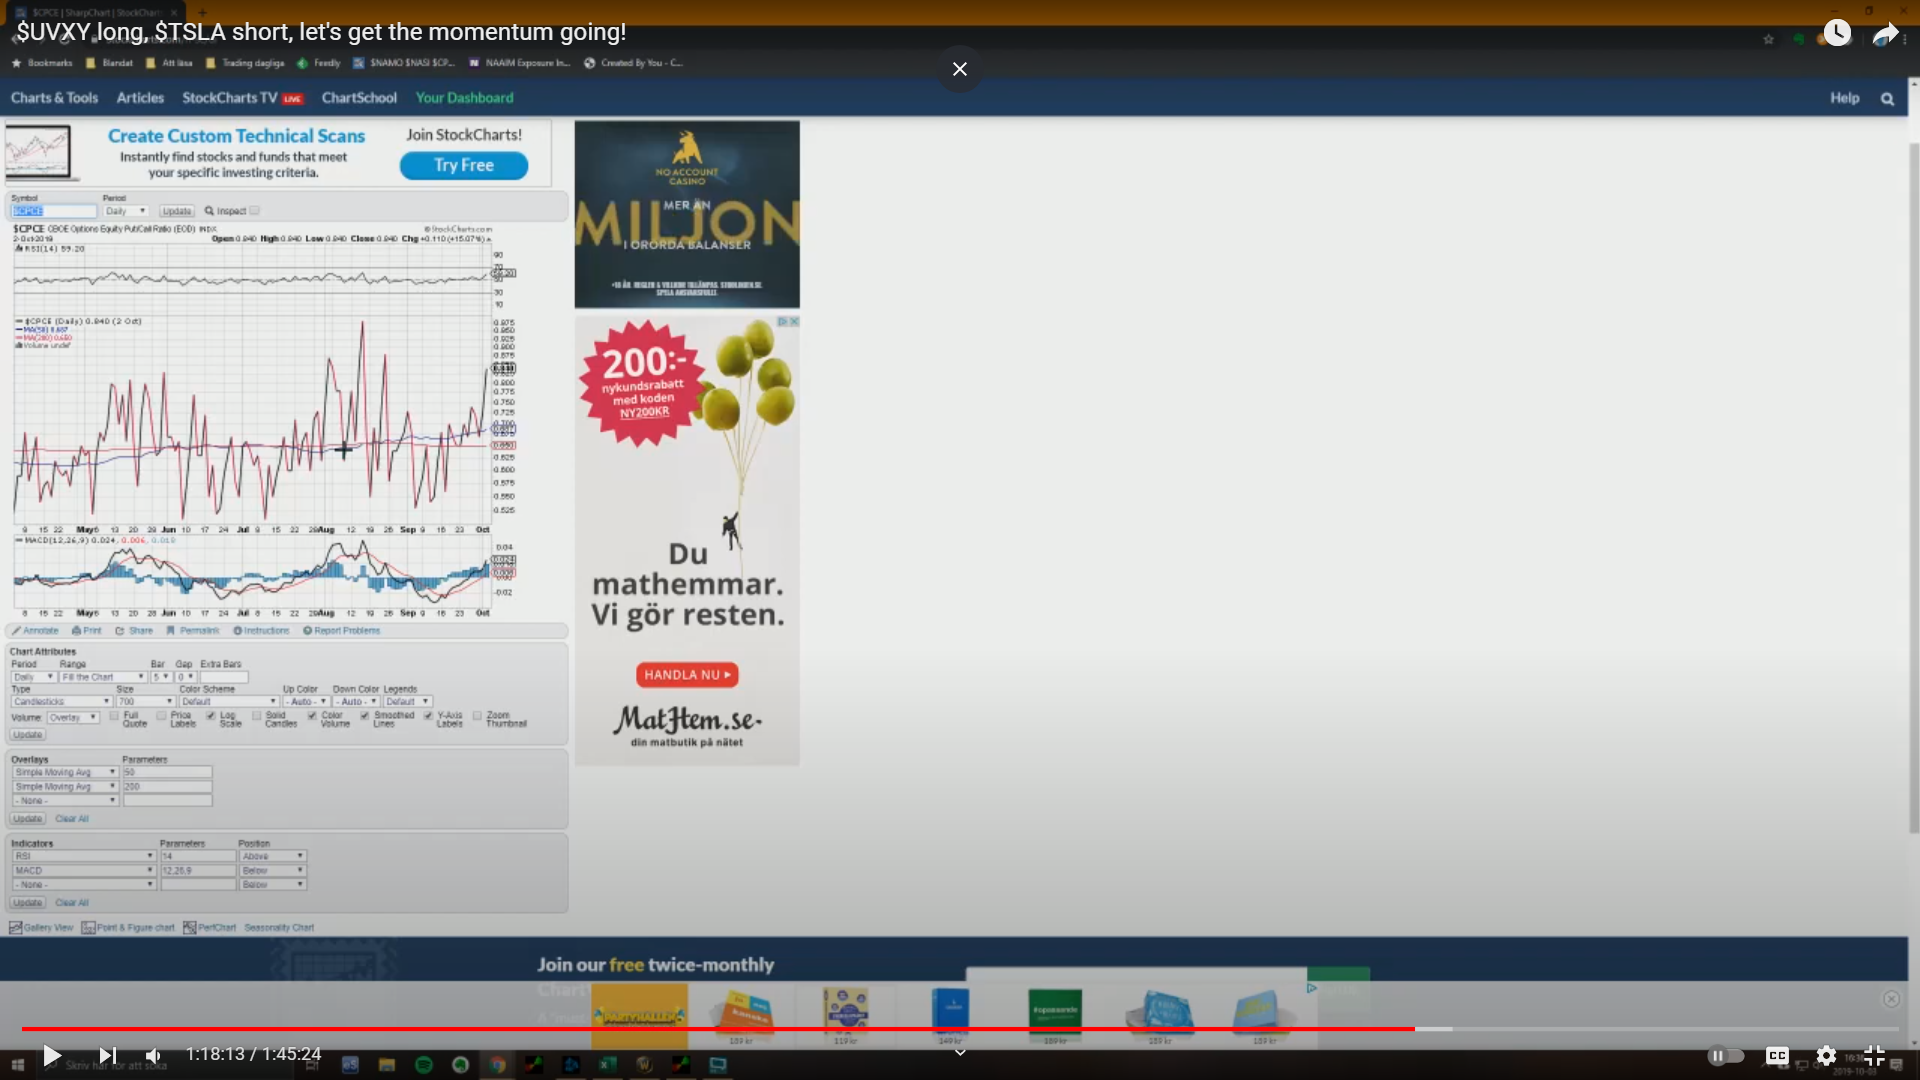 I don’t look at these things every day but I usually look at them once or week or so just to see, it’s good to be aware what’s going on in the markets under the surface.
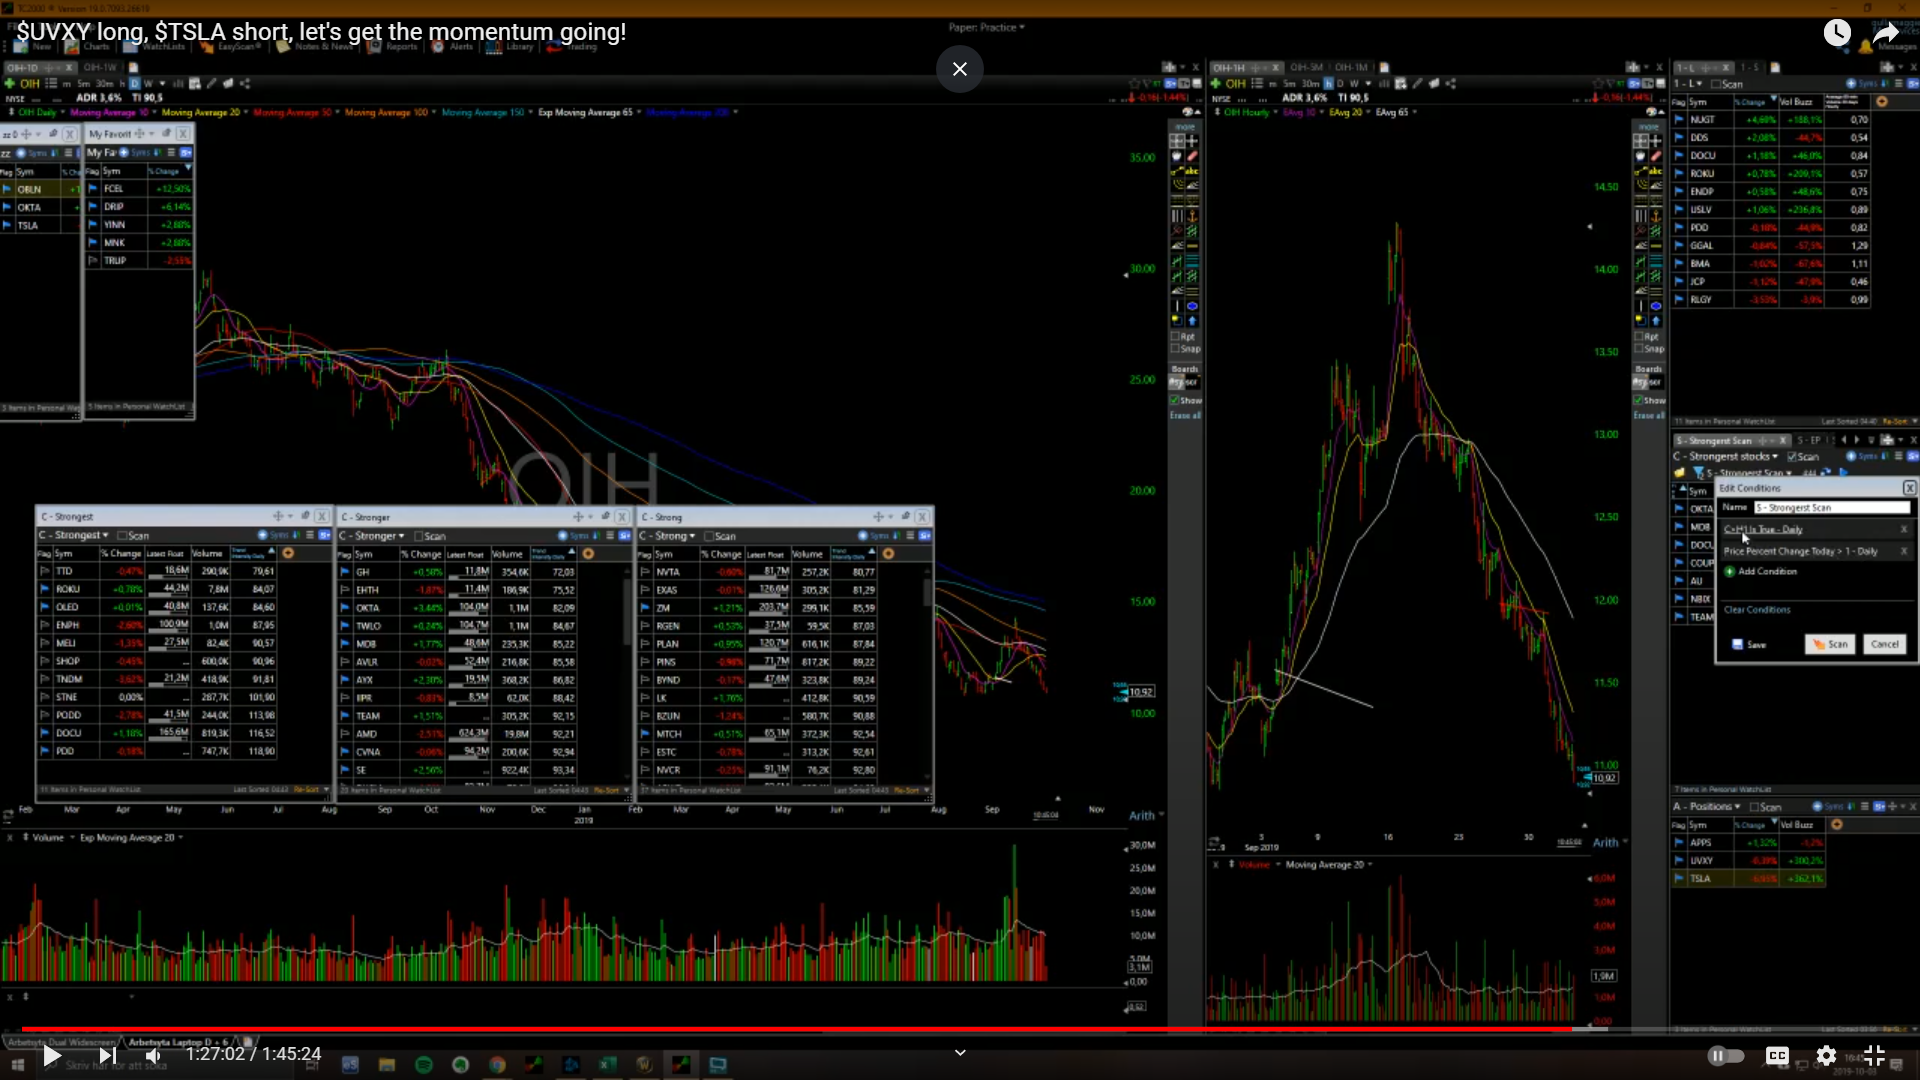 And I find ideas from these gainer scans, the strongest 3-4% stocks in the US markets that are liquid. Then I look up the numbers very quickly in Marketsmith, the best ones for me over the years are stocks that have big growth and big estimates, I like to combine fundamentals and momo.