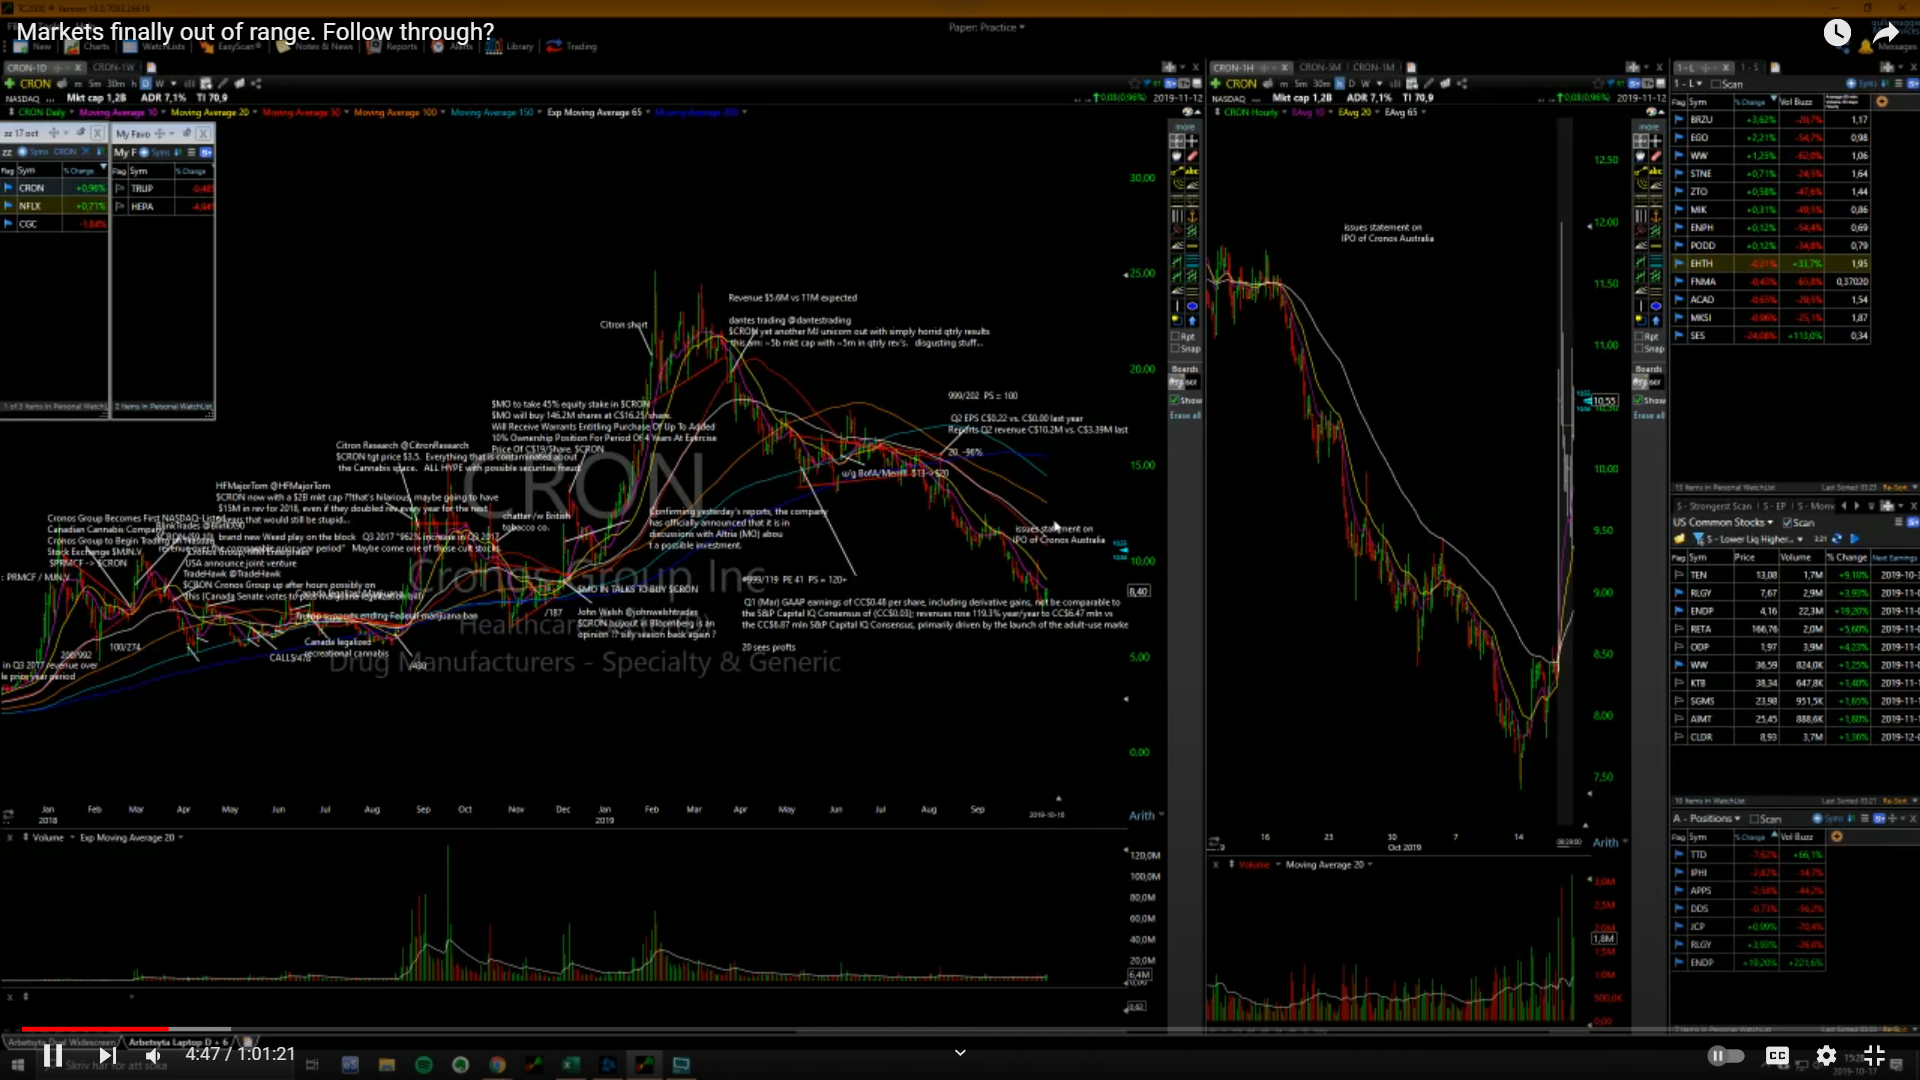
CRON is going to ipo in Australia, well I guess they need money, wow am I seeing this right CRON is trading at 100x sales, they have about 25M in sales the past 12months and the mcap is 2.8B.
EWZ is just starting to come out of this bullflag in a bullflag, I bought 10kshares half size BRZU, ultra tight stop.
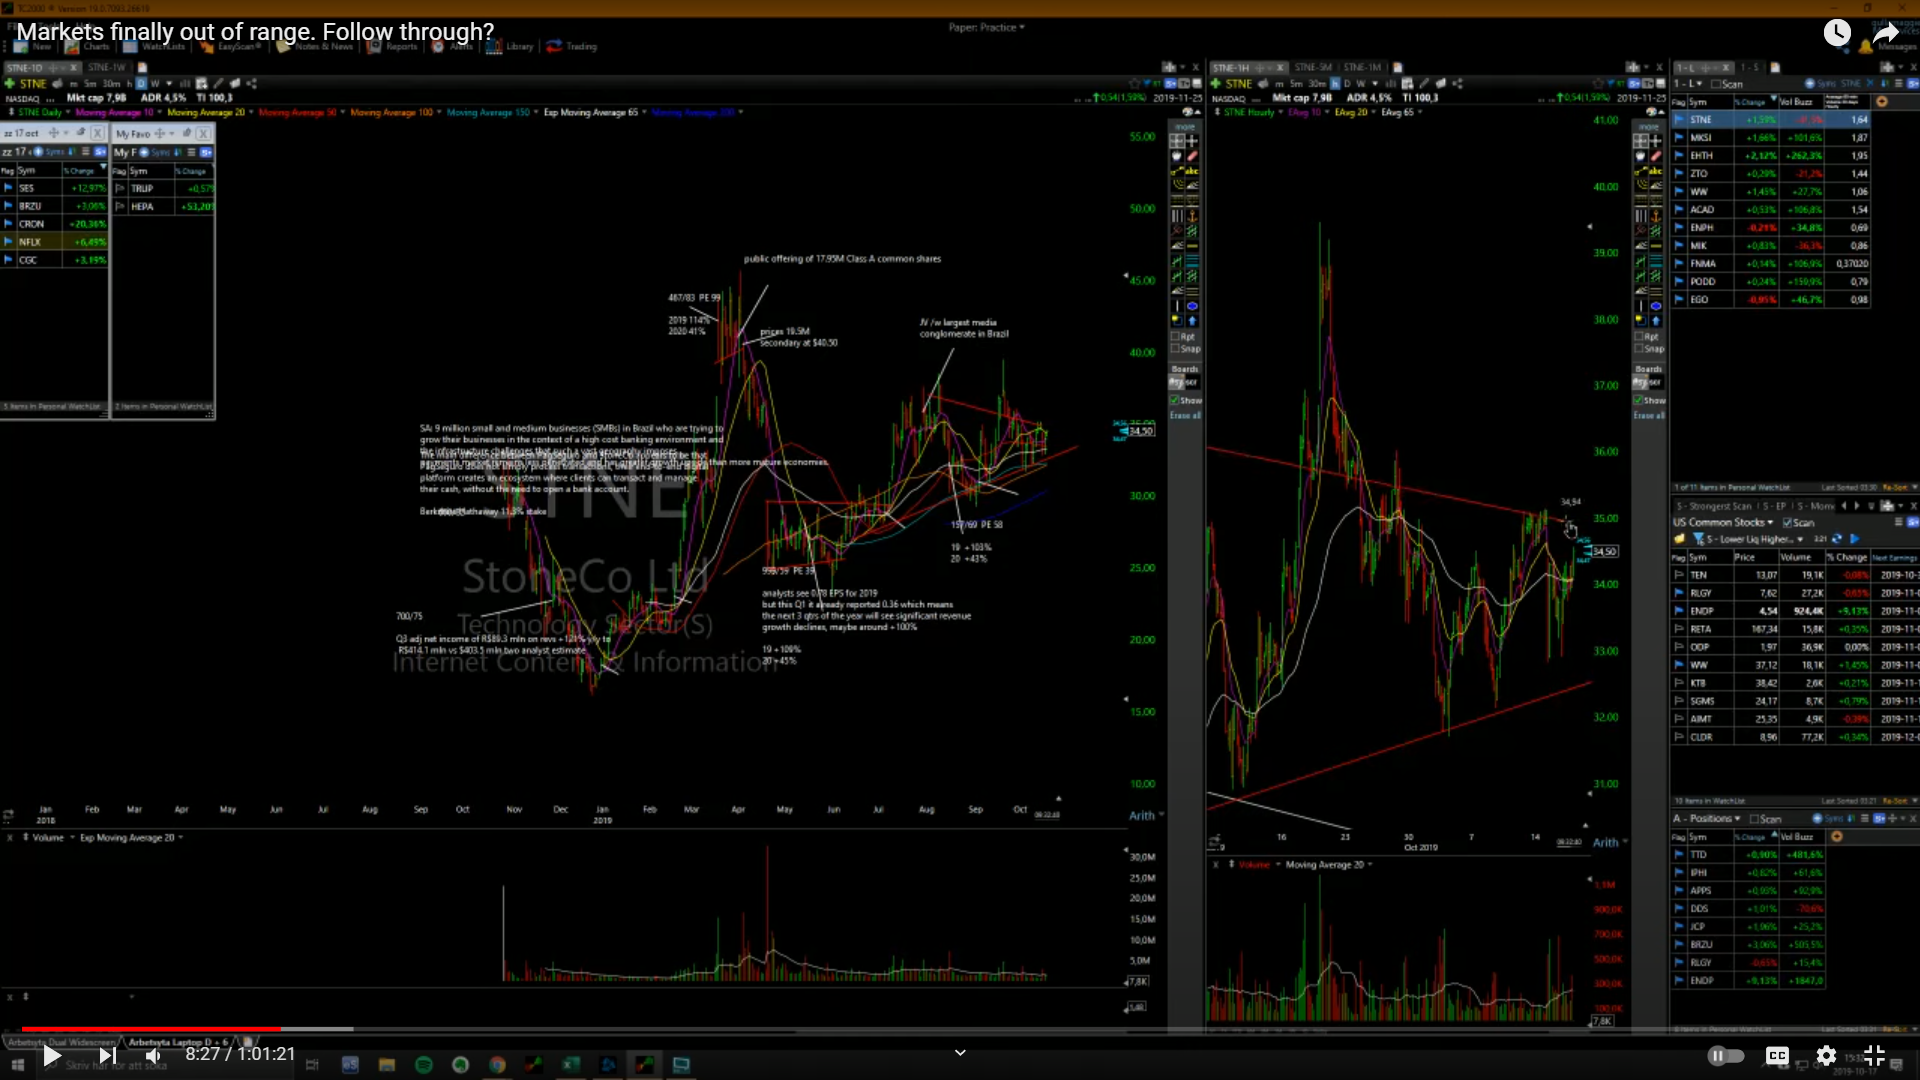
STNE looking very interesting, been building hls for 6months, starting to take out a little range on the weekly and also the daily.
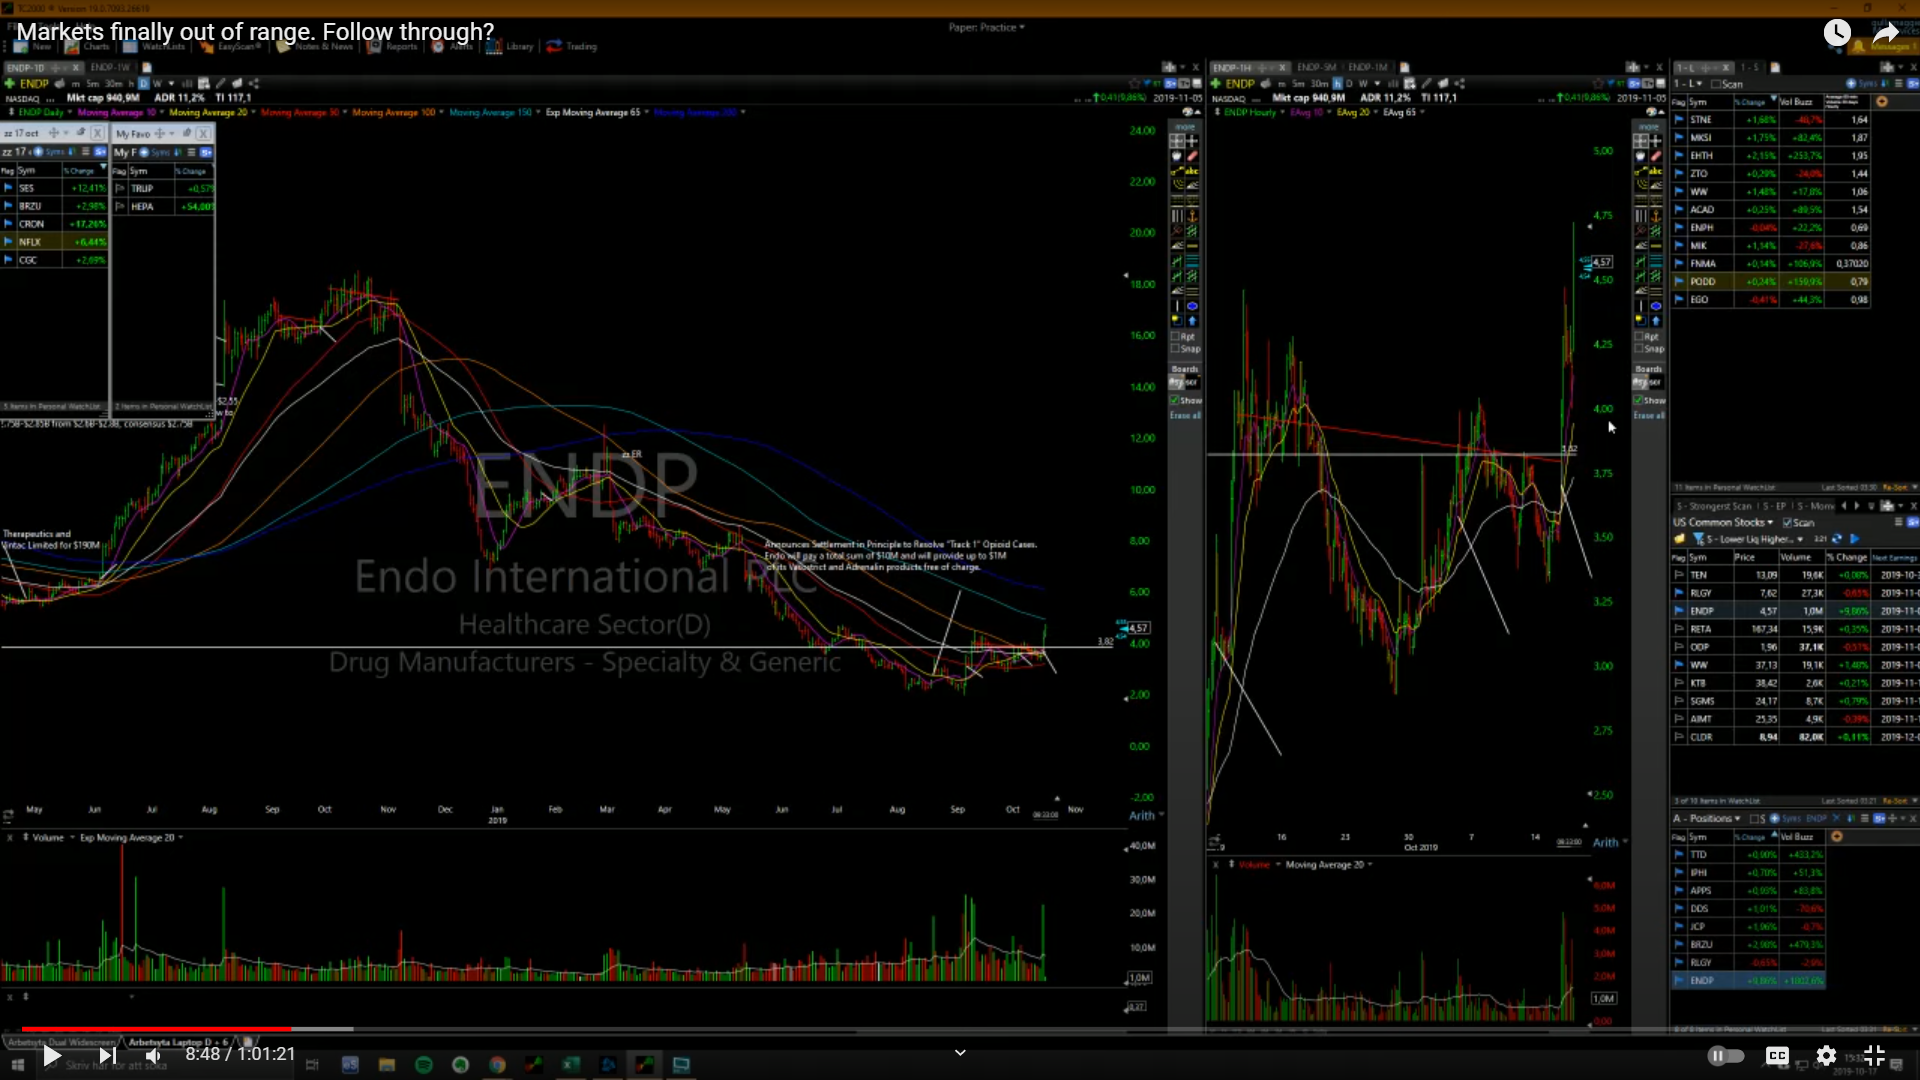
ENDP some insane follow through from yday, I’m gonna sell some here almost 20%, I’m up like 25% on it.
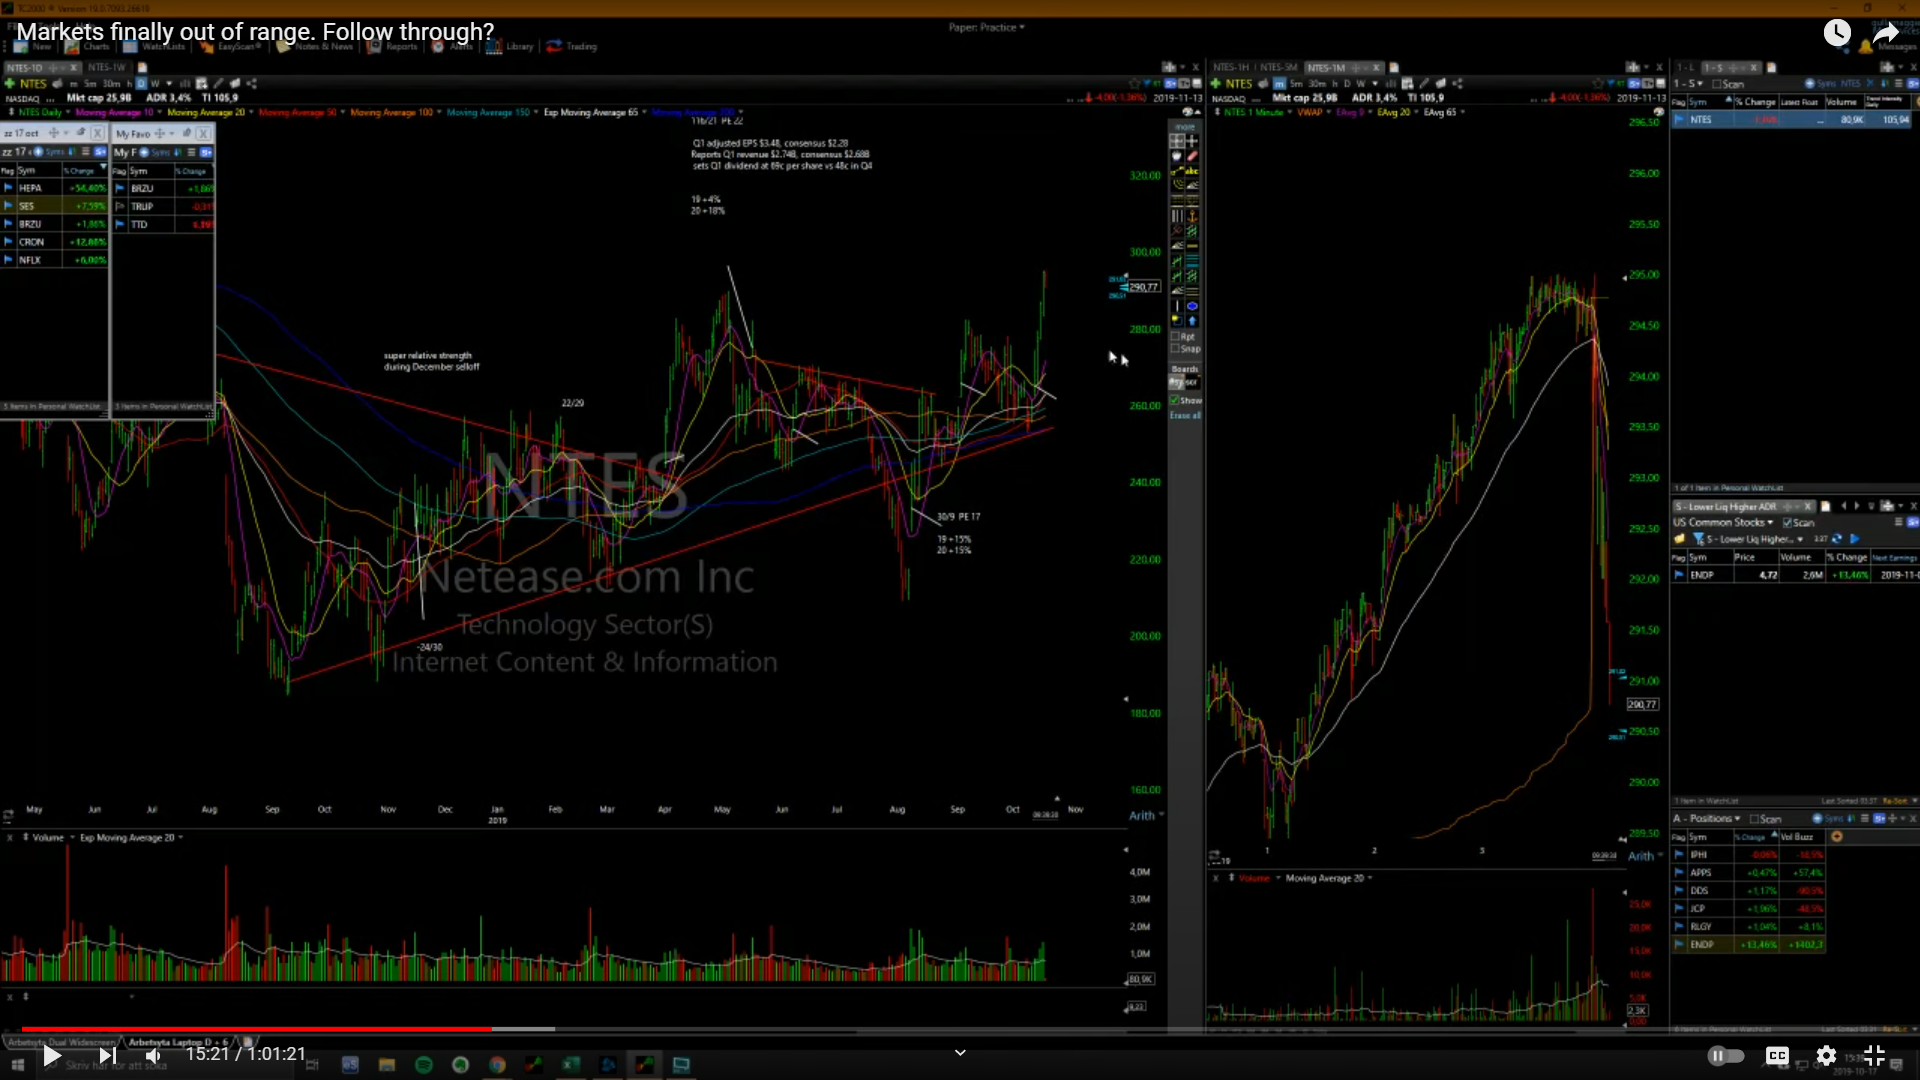
NTES I missed, was up 5days in a row getting a little bit extended so I was thinking maybe I could find a tight tight intraday setup on this, not a big move but usually when a stock is up 4/5days in a row my logic is it’s eventually gonna have a down day. But there may be a re entry on this thing, maybe on a bounce.
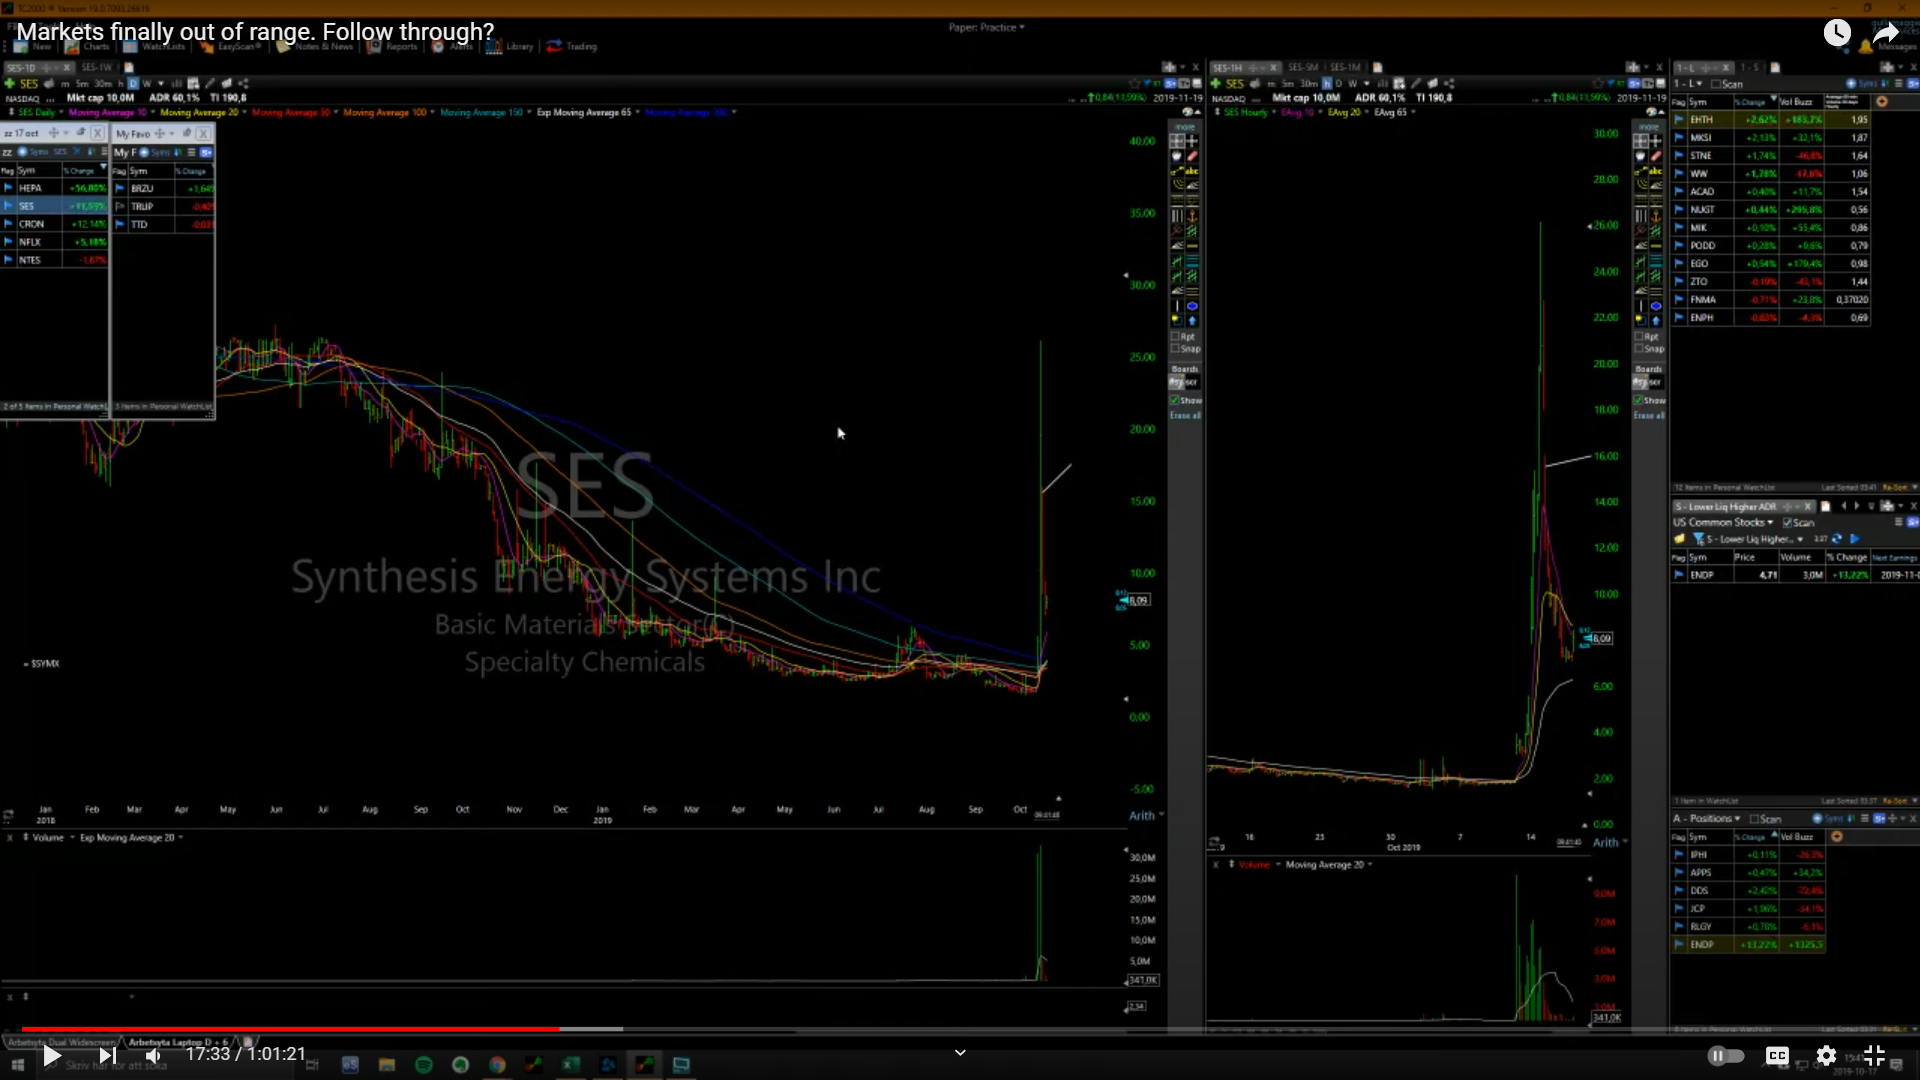
SES trying to bounce, took out intraday lows and now it’s trying to go higher, super thin, if it was more liquid I would maybe try it with a tight stop in case it went back to 10 but I don’t think the setup is there, would have been better with a gap down. Omg look at that bounce from 8 to almost 10 in less than 3mins, I didn’t want to trade it bc I was afraid it would be even more illiquid than yday. Okay SES is trying to take another leg higher, this thing could go higher than anyone things could go back to 12 or something wouldn’t surprise me at all. SES there’s the bounce, hit 11 bucks.
PLX another daily doubler, look what happened didn’t get many of these big micro cap moves and then we had SES and now the past 3days there have been like ten microcaps that have doubled, it’s one stock that sparks so many others. Those things happen in cycles, microcap momo happens in cycles, can be dead for months and months and then just suddenly wake up. PLX was really nice off the 1min orhs, could have risked like 2c, went up 17c and could go up even more, classic pump stock. PLX had an old data pr and it’s a double on that.
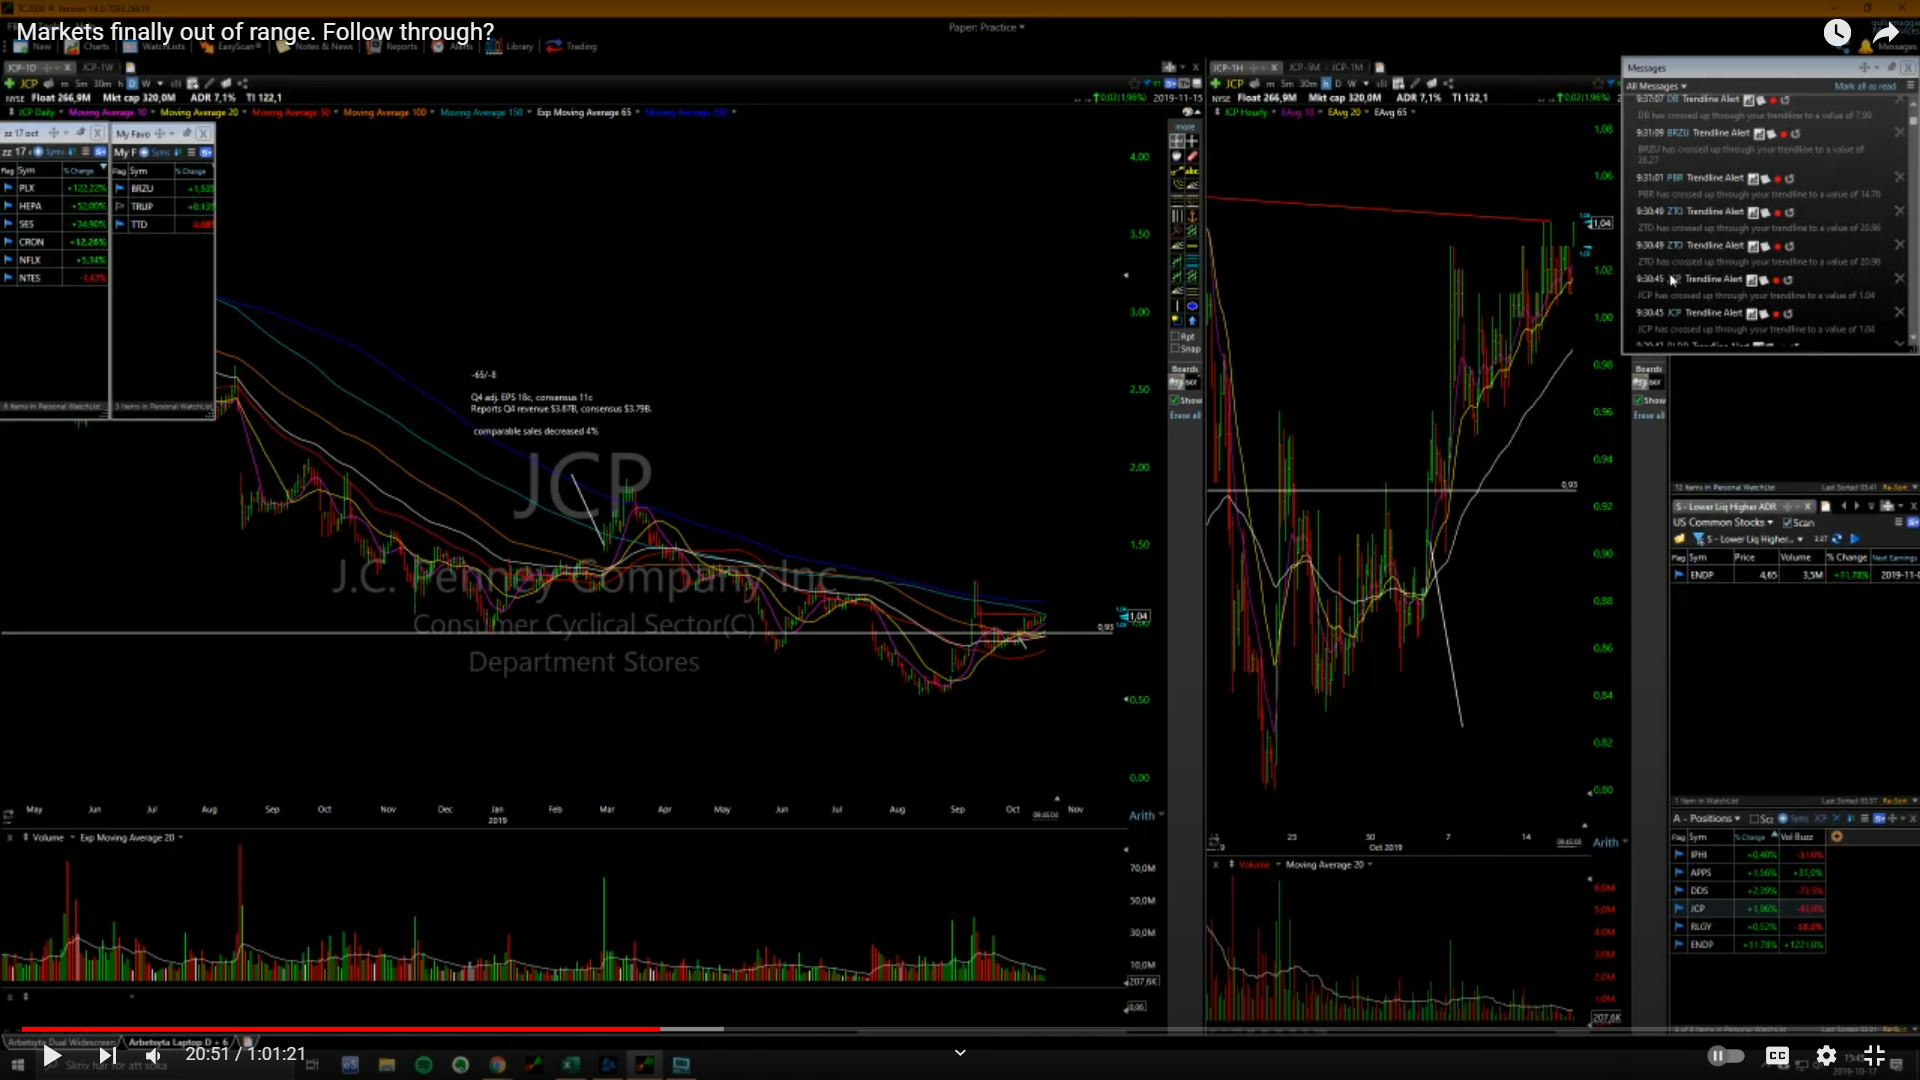
JCP doesn’t have much volume but still this pattern is fascinating, just building hls every single day.
FRAN still going, ultra illiquid, but I wouldn’t be surprised if it goes to 30 seriously, on the first leg higher went up almost 300%, then went sideways for about a month and a half, then breaking out entry was last week. So it tripled, why can’t it double from this pattern? So I usually well some into strength always, and then I look at where it closes, when it starts closing below certain MAs that’s when I scale out, let’s say on FRAN if I bought this breakout here, I would probably have sold maybe 20/25% and then have a b/e stop, and then if it closes below the 10day I would sell out 1/4 or 1/3, and if it closes below the 20day I would close out another 1/4 or 1/3, that’s how I scale out. But it also depends on the stock, these kinda faster stocks you prob have to use the 10/20day, when this thing hits the 50day it’s prob gonna be down 50% from the highs.
AIMT kinda had this high volume day then flagged for a week and then it had a bit of a breakout, up every day since pretty much.
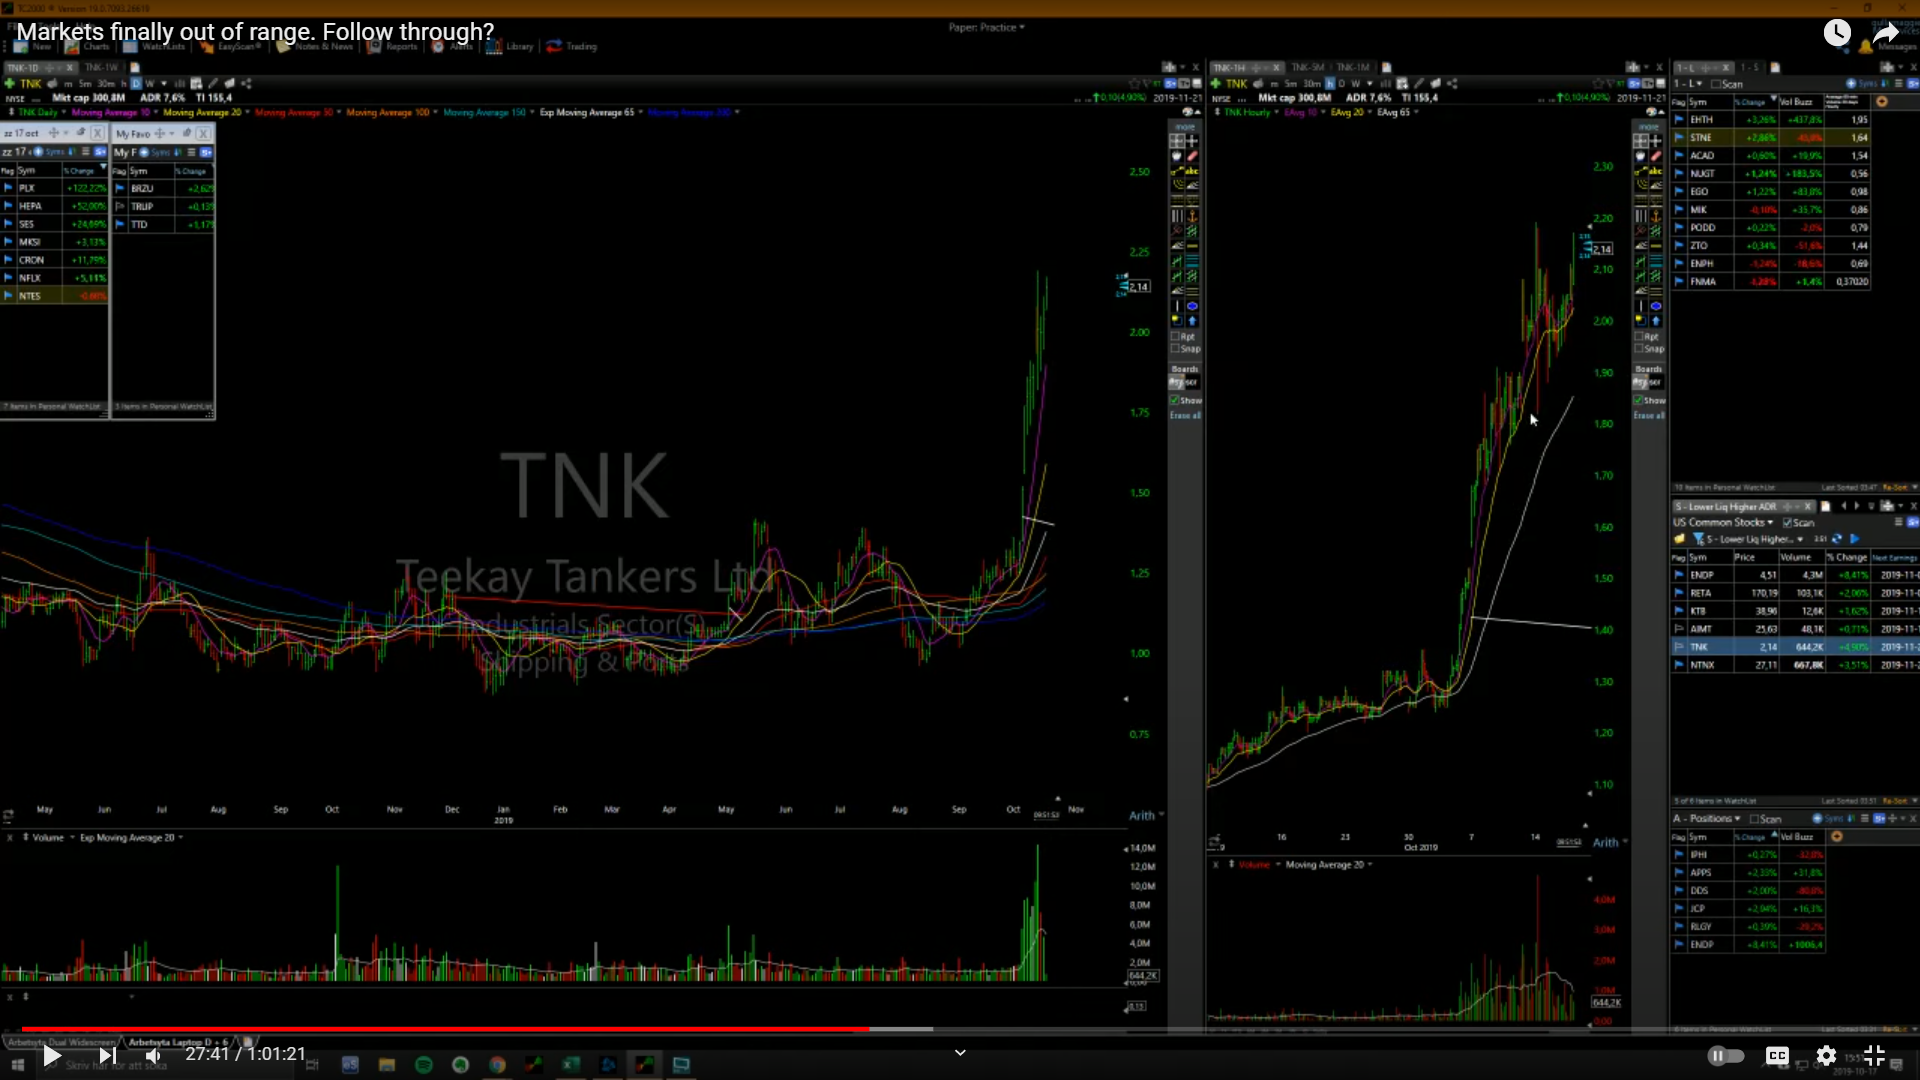
TNK wants to go higher, also just look at the 60min, hls all the way, this is what buying looks like, every time the stock tries to go down someone scoops it up, this is very strong buying.
XBIO yday actually had a very interesting intraday pattern, gapped up on extremely high volume, pulled back found support on this 5min 20ema, then it kinda went sideways the whole day built hls, then it took out this range here went up 50% in a couple of hours, then faded back. These patterns happen on all time frames, daily, intraday, weekly, these flag patterns are very powerful. The more powerful the first leg higher is, the more powerful the next leg higher is going to be most of the time.
TEAM bounced off this 200day, look how nicely it’s been riding the 200day, bounced off, bounced off and undercut, and then now it’s just found support again on the 200day.
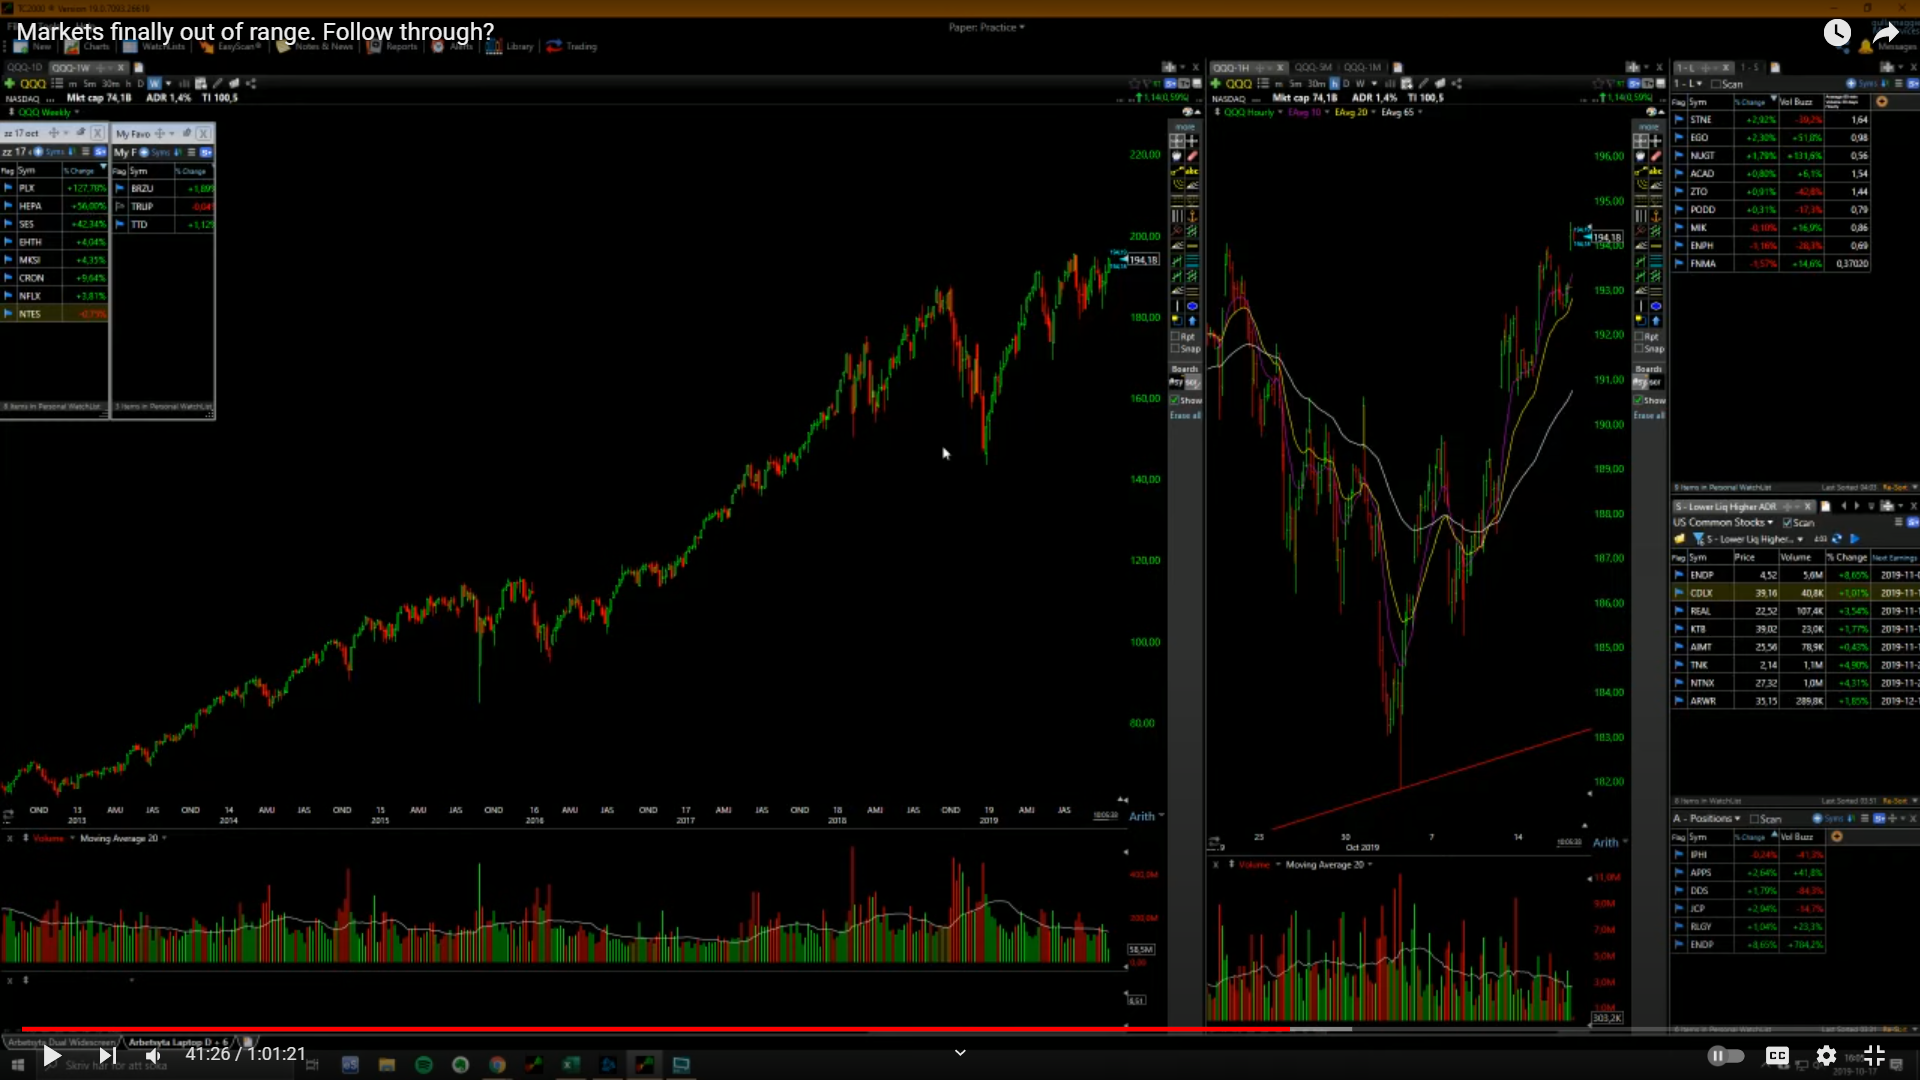
On the weekly chart, the major indices look so good, look at this thing QQQ been building hls for 2years, had this big big washout then it came right back and now it’s just putting in hls, getting so tight here. Same with the SPYs, had this big washout, sentiment down here late Dec2018 was as bearish or even more than the sentiment was in 2008, just insane, then it had a big rally and getting tighter and tighter. IWM not as good but been going sideways for a long time, just in this channel. ASHR looks great, look at the China stocks, looks bullish hls, potential range break coming up.
If the market wants to go higher it’s gonna go higher no matter what, every bull run there’s a lot of doubt, since I started trading in 2011, a lot of people have been so bearish for years and years and still the markets going higher, Idk I follow price action, you can’t listen to people’s opinions most of the time they’re worthless, the only thing you have to listen to is the price action. And what I see on the price action is most things looking pretty healthy.
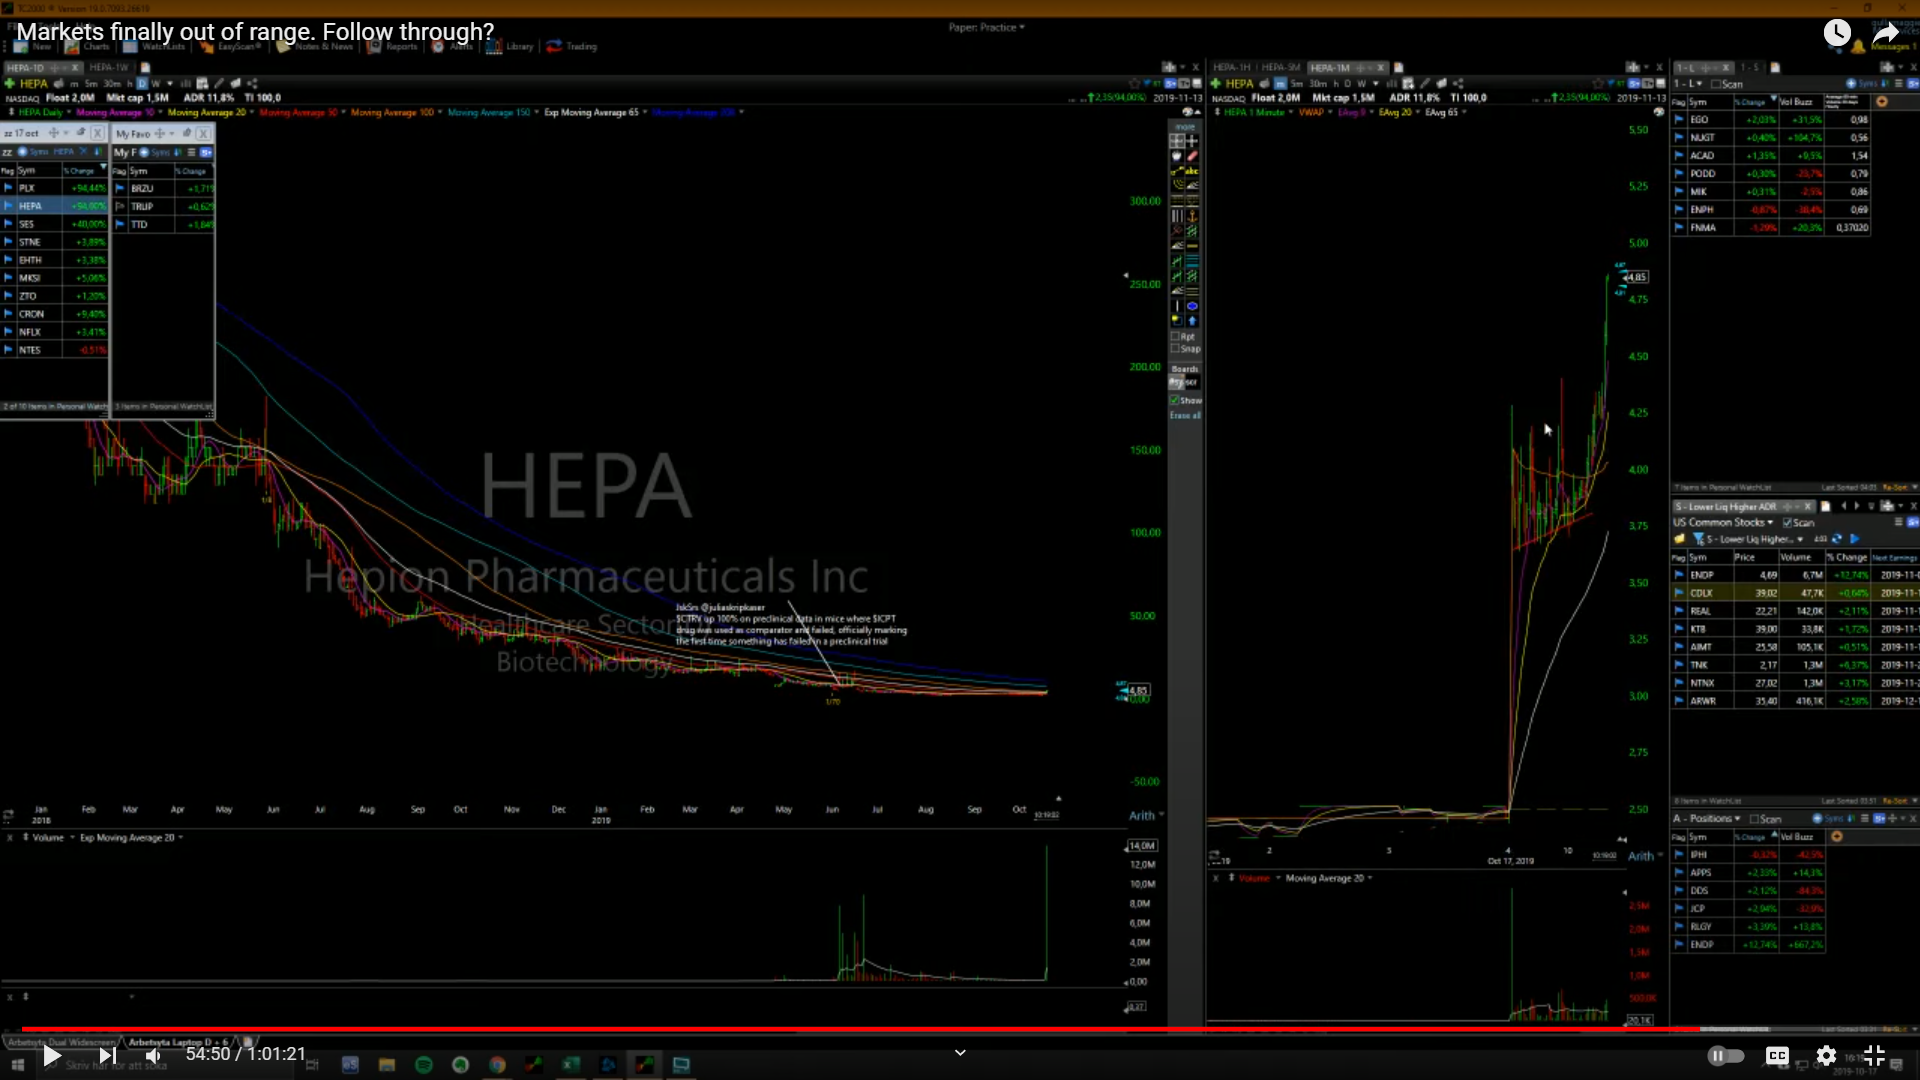
HEPA trying to come back, kinda been building hls for a while and now it’s above the vwap again. Idk what’s the news, okay it’s mice data, that’s totally worthless. I was a little bit tempted buying here in this this 4.10s area but now I don’t wanna chase it up here, but yeah when it reclaimed vwap for like the 10th time with hls, on this candle, if I had seen it down here I would have bought like 30kshares, in case it does go up 50% from here, now it’s just chasing could very easily slam down. Omg HEPA was at 5.80 premarket I didn’t see that, so it faded from 5.80 to 3.45 premarket. HEPA going, gonna go to 6, there is definitely opps in this market, so I missed some I was a little bit too late.

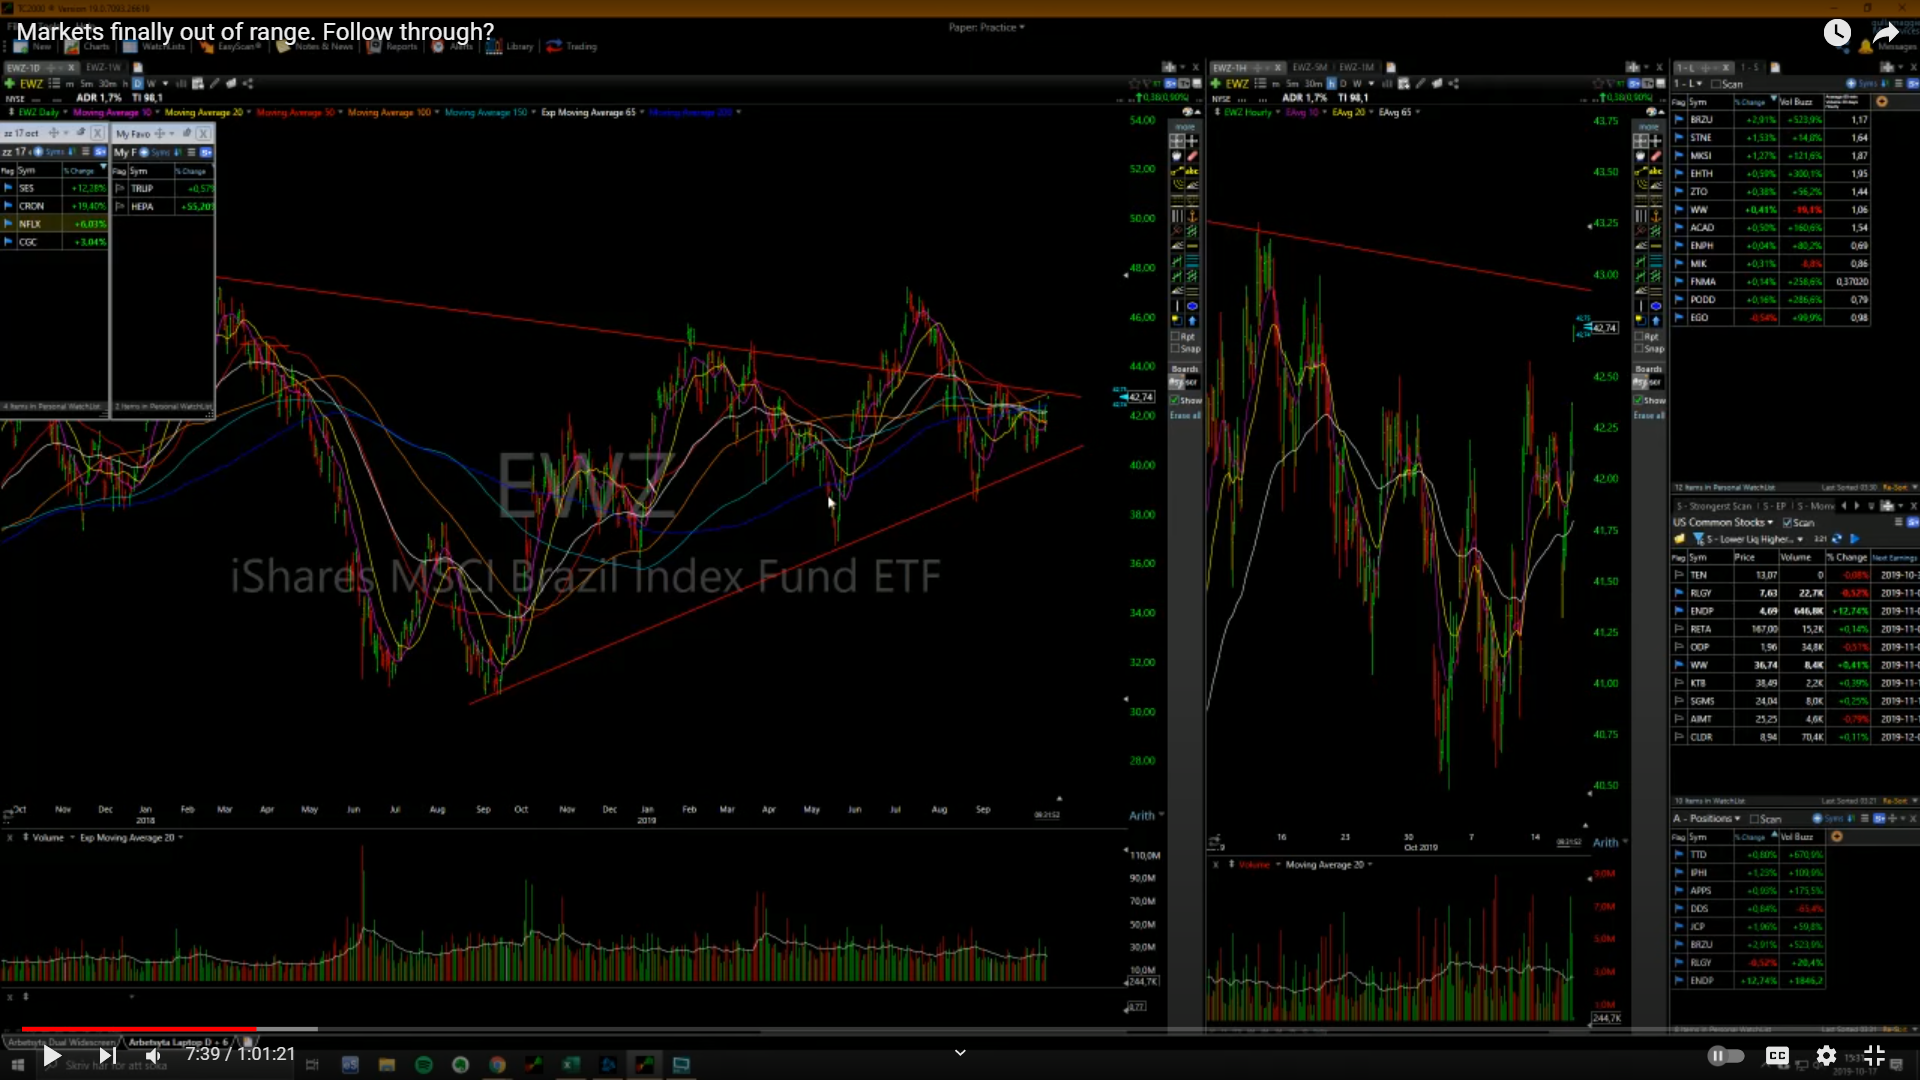 I bought 10kshares half size BRZU, ultra tight stop.
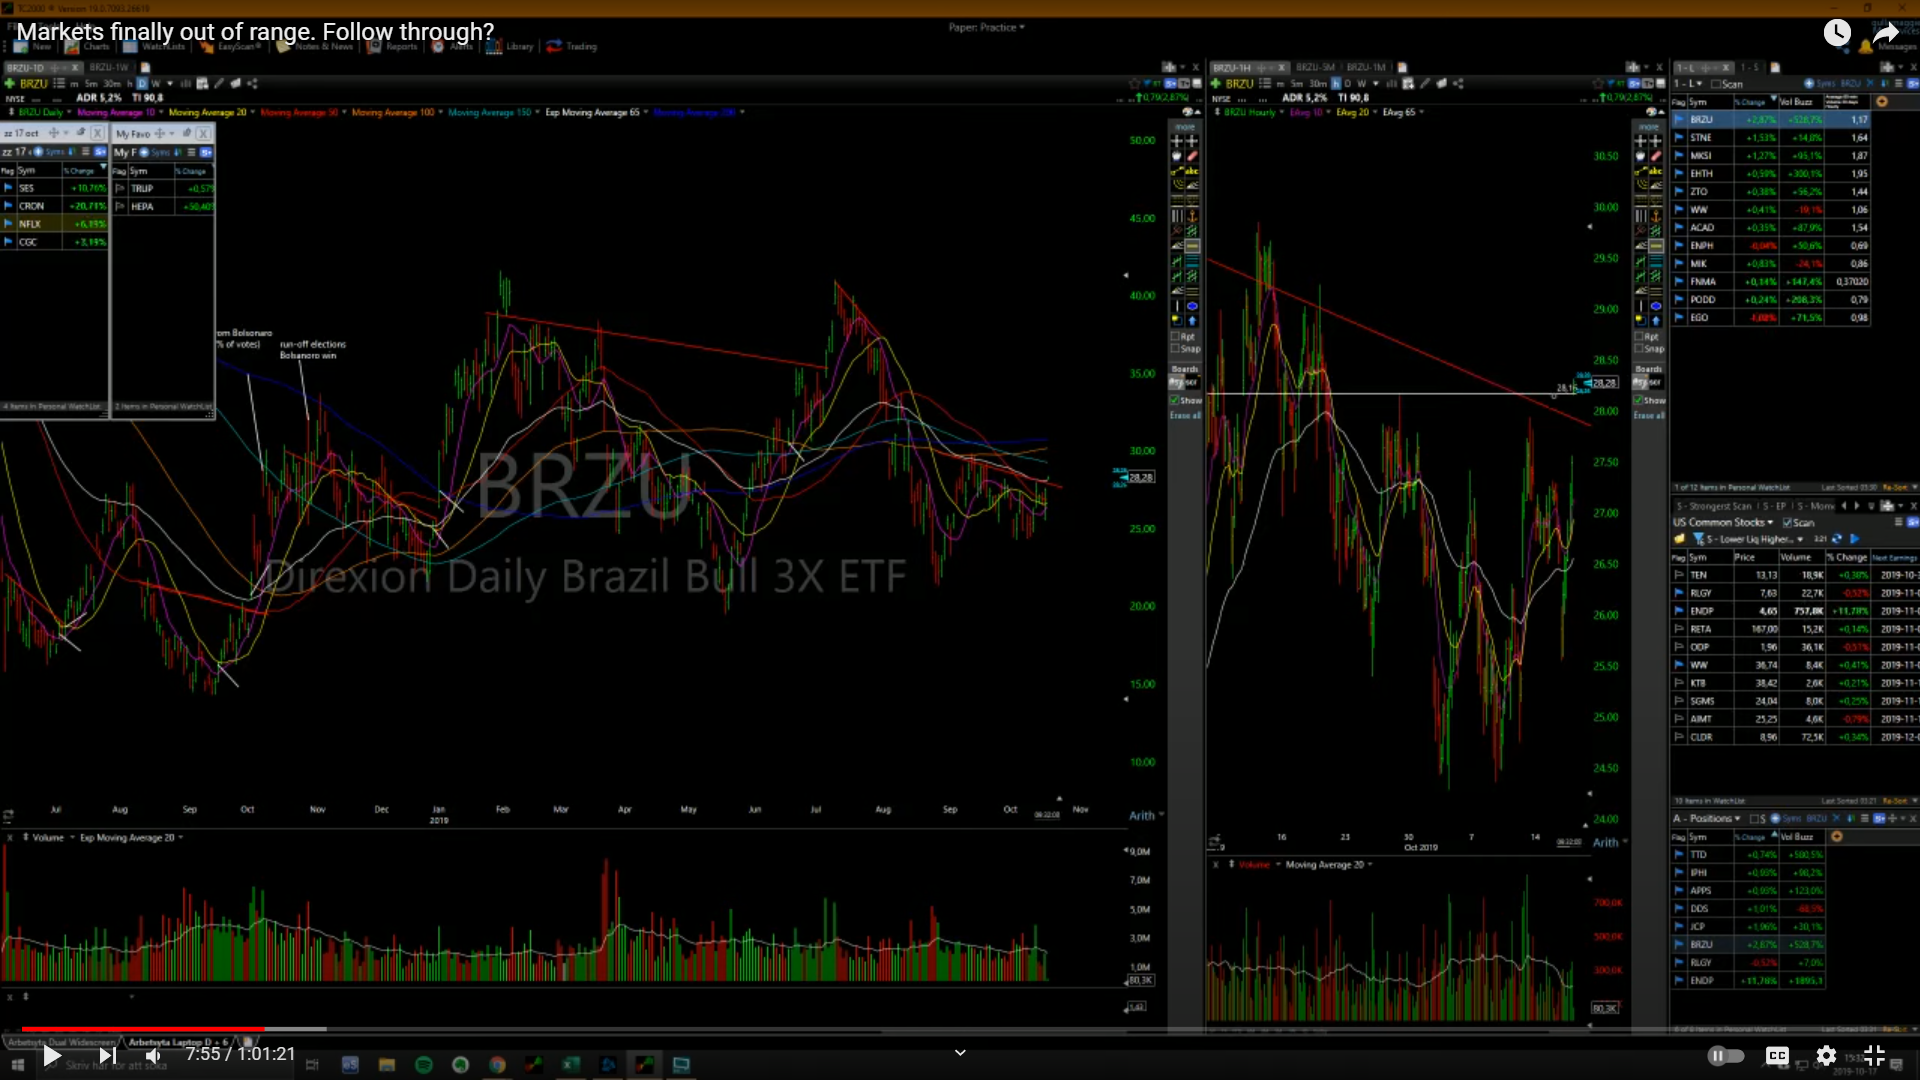
 Omg look at that bounce from 8 to almost 10 in less than 3mins, I didn’t want to trade it bc I was afraid it would be even more illiquid than yday. Okay SES is trying to take another leg higher, this thing could go higher than anyone things could go back to 12 or something wouldn’t surprise me at all.
 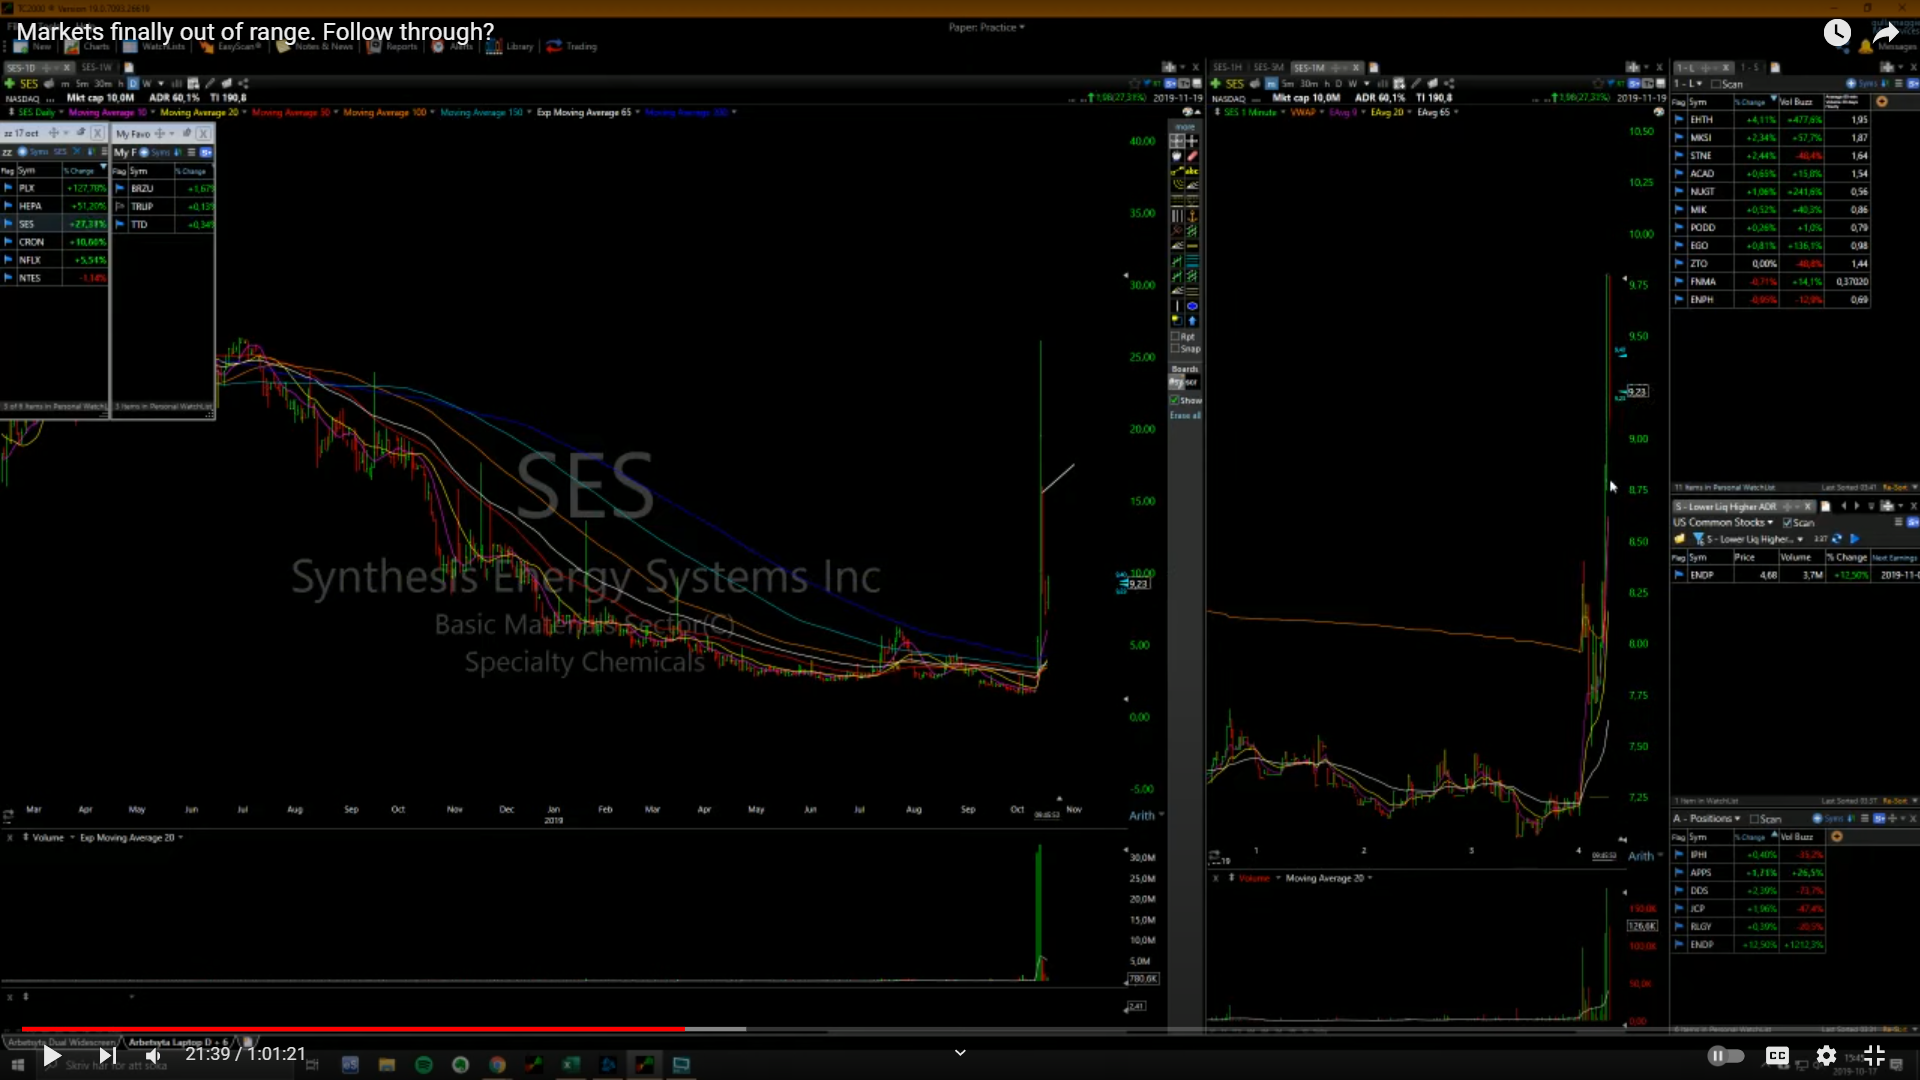 SES there’s the bounce, hit 11 bucks.
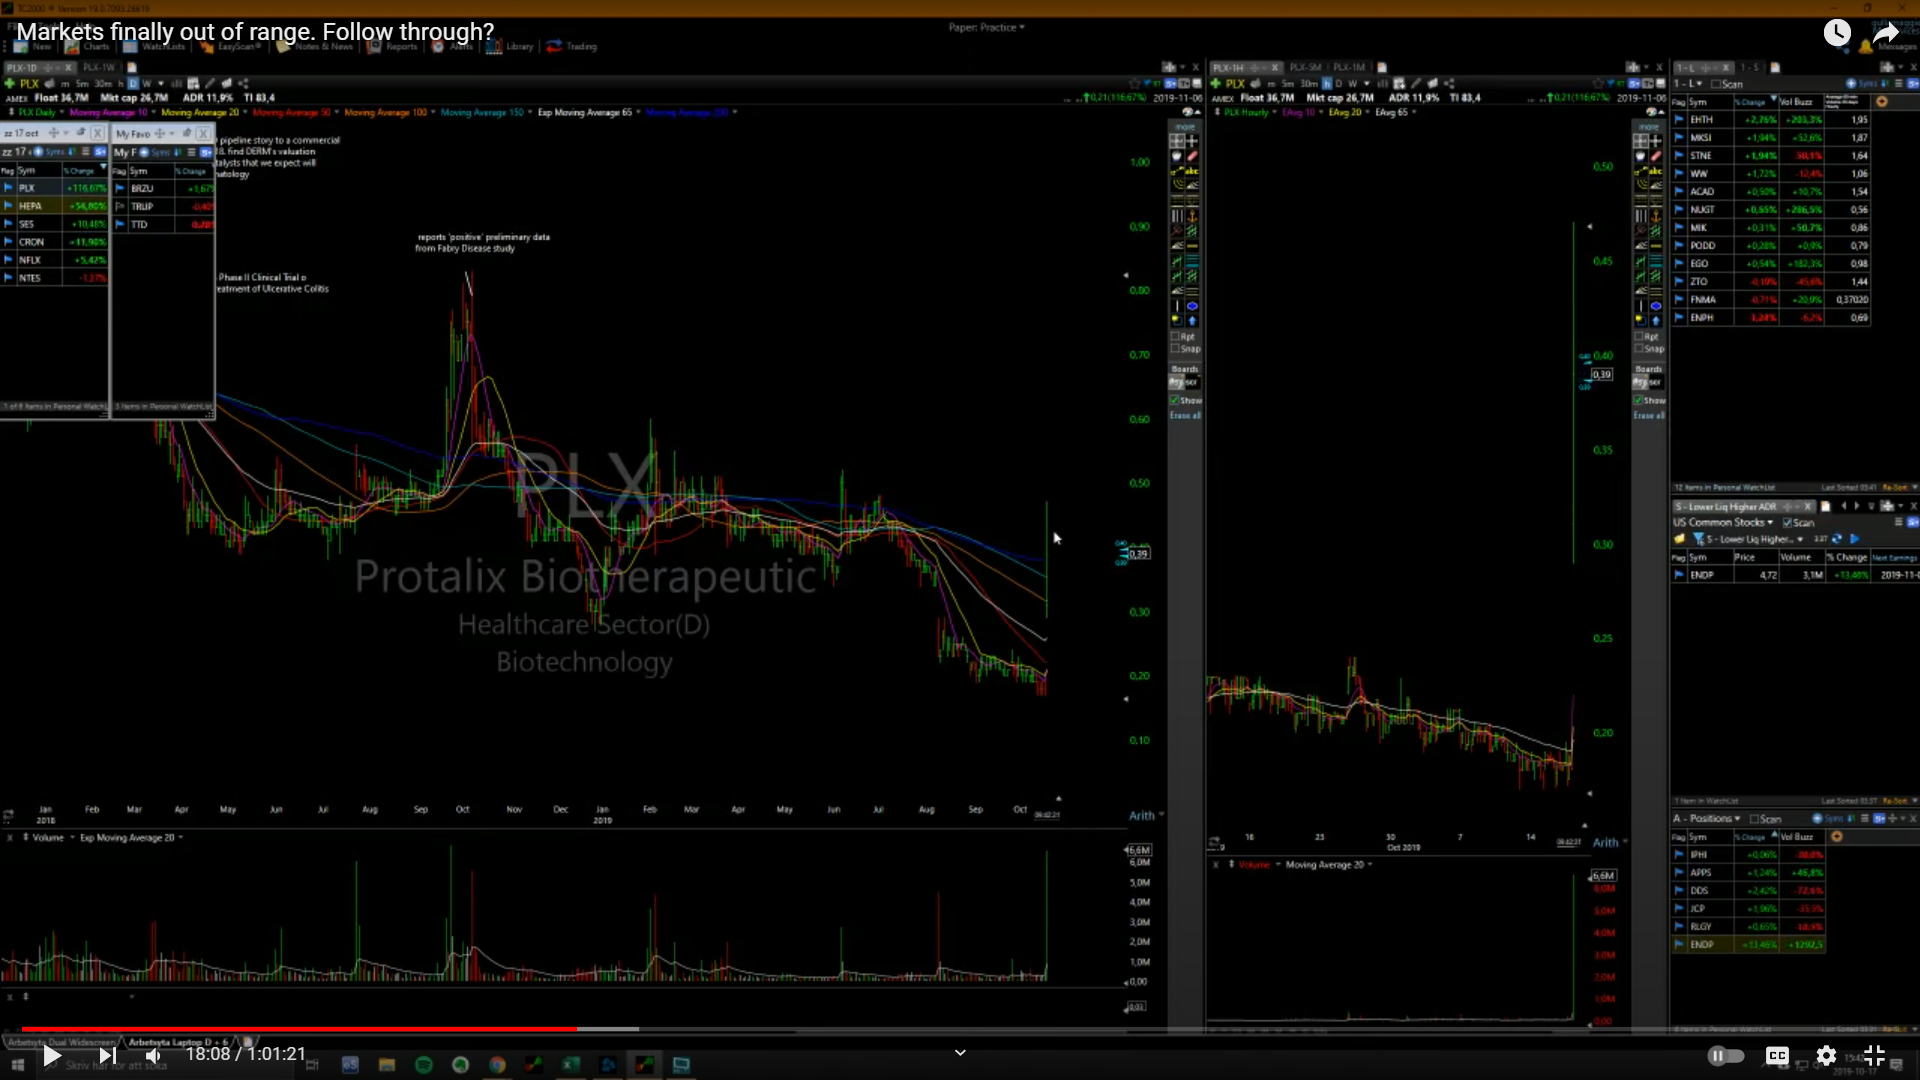 PLX was really nice off the 1min orhs, could have risked like 2c, went up 17c and could go up even more, classic pump stock. PLX had an old data pr and it’s a double on that.
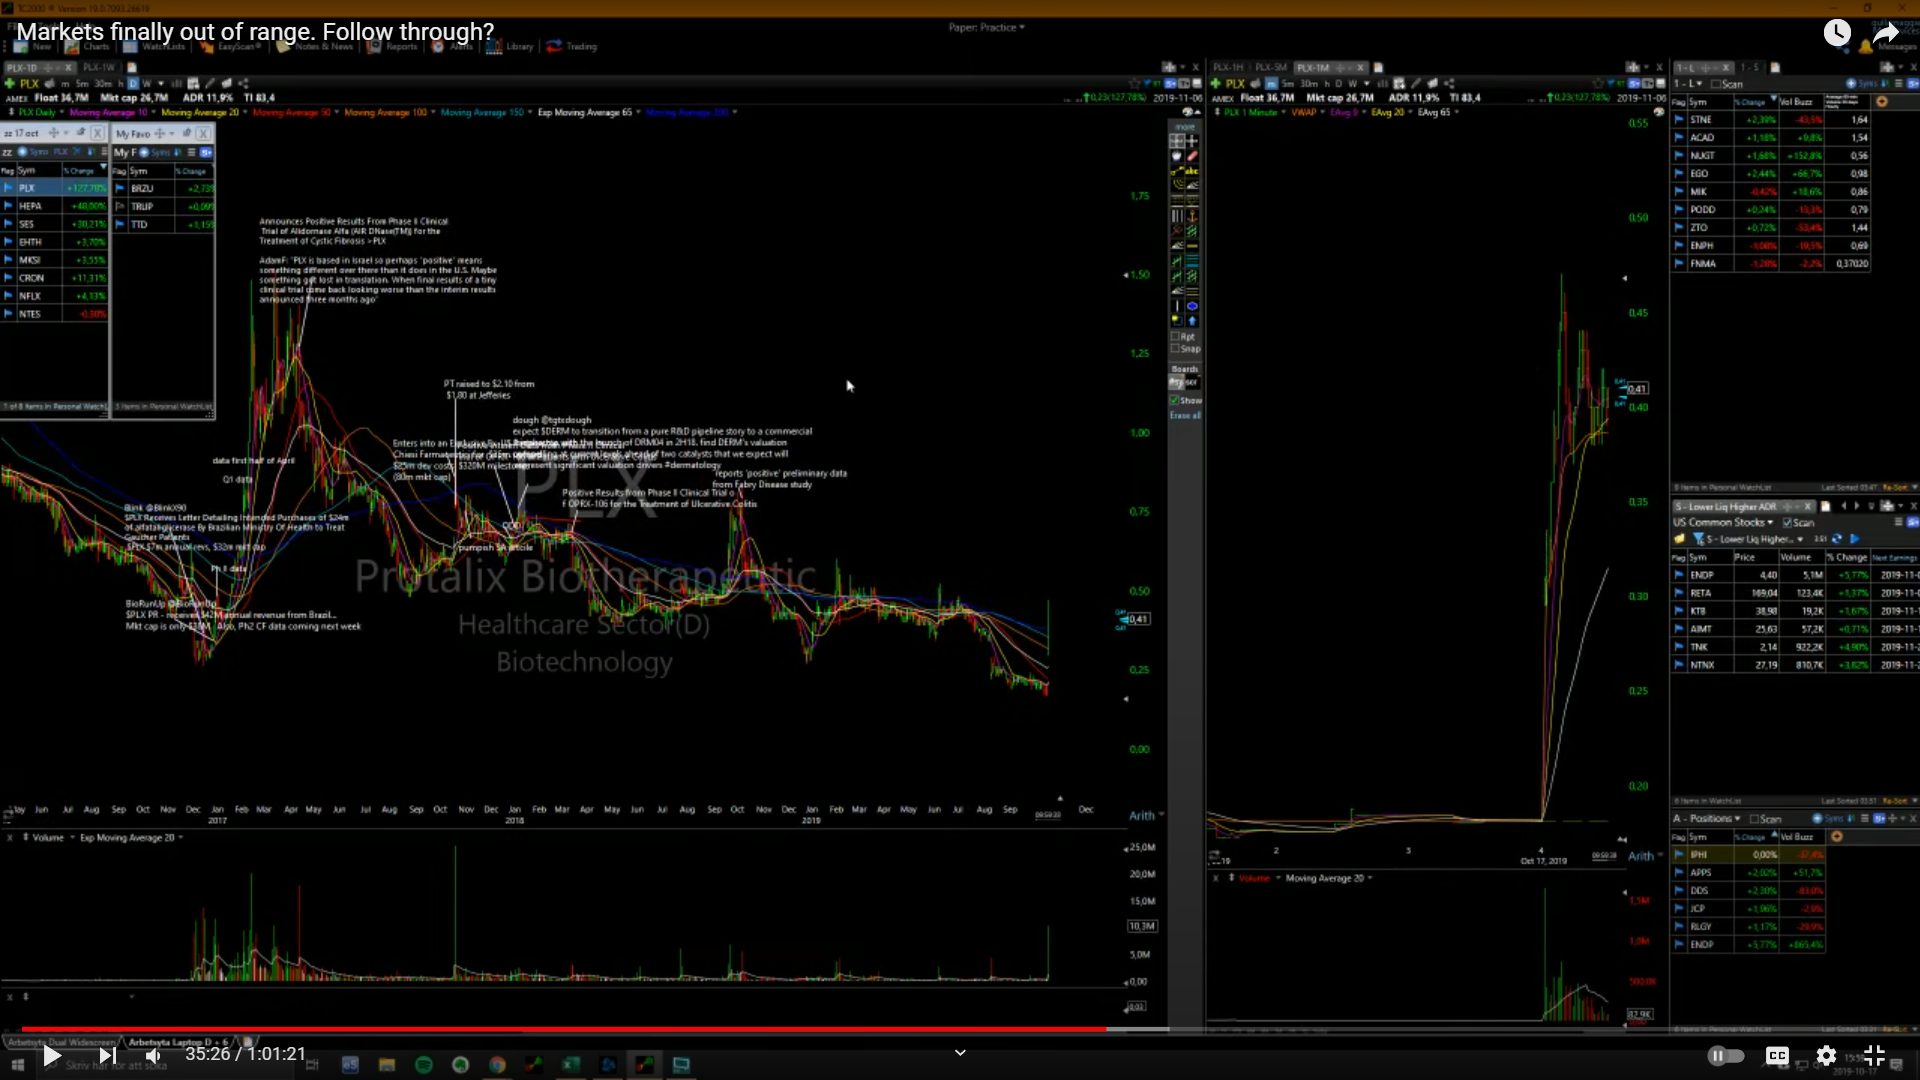
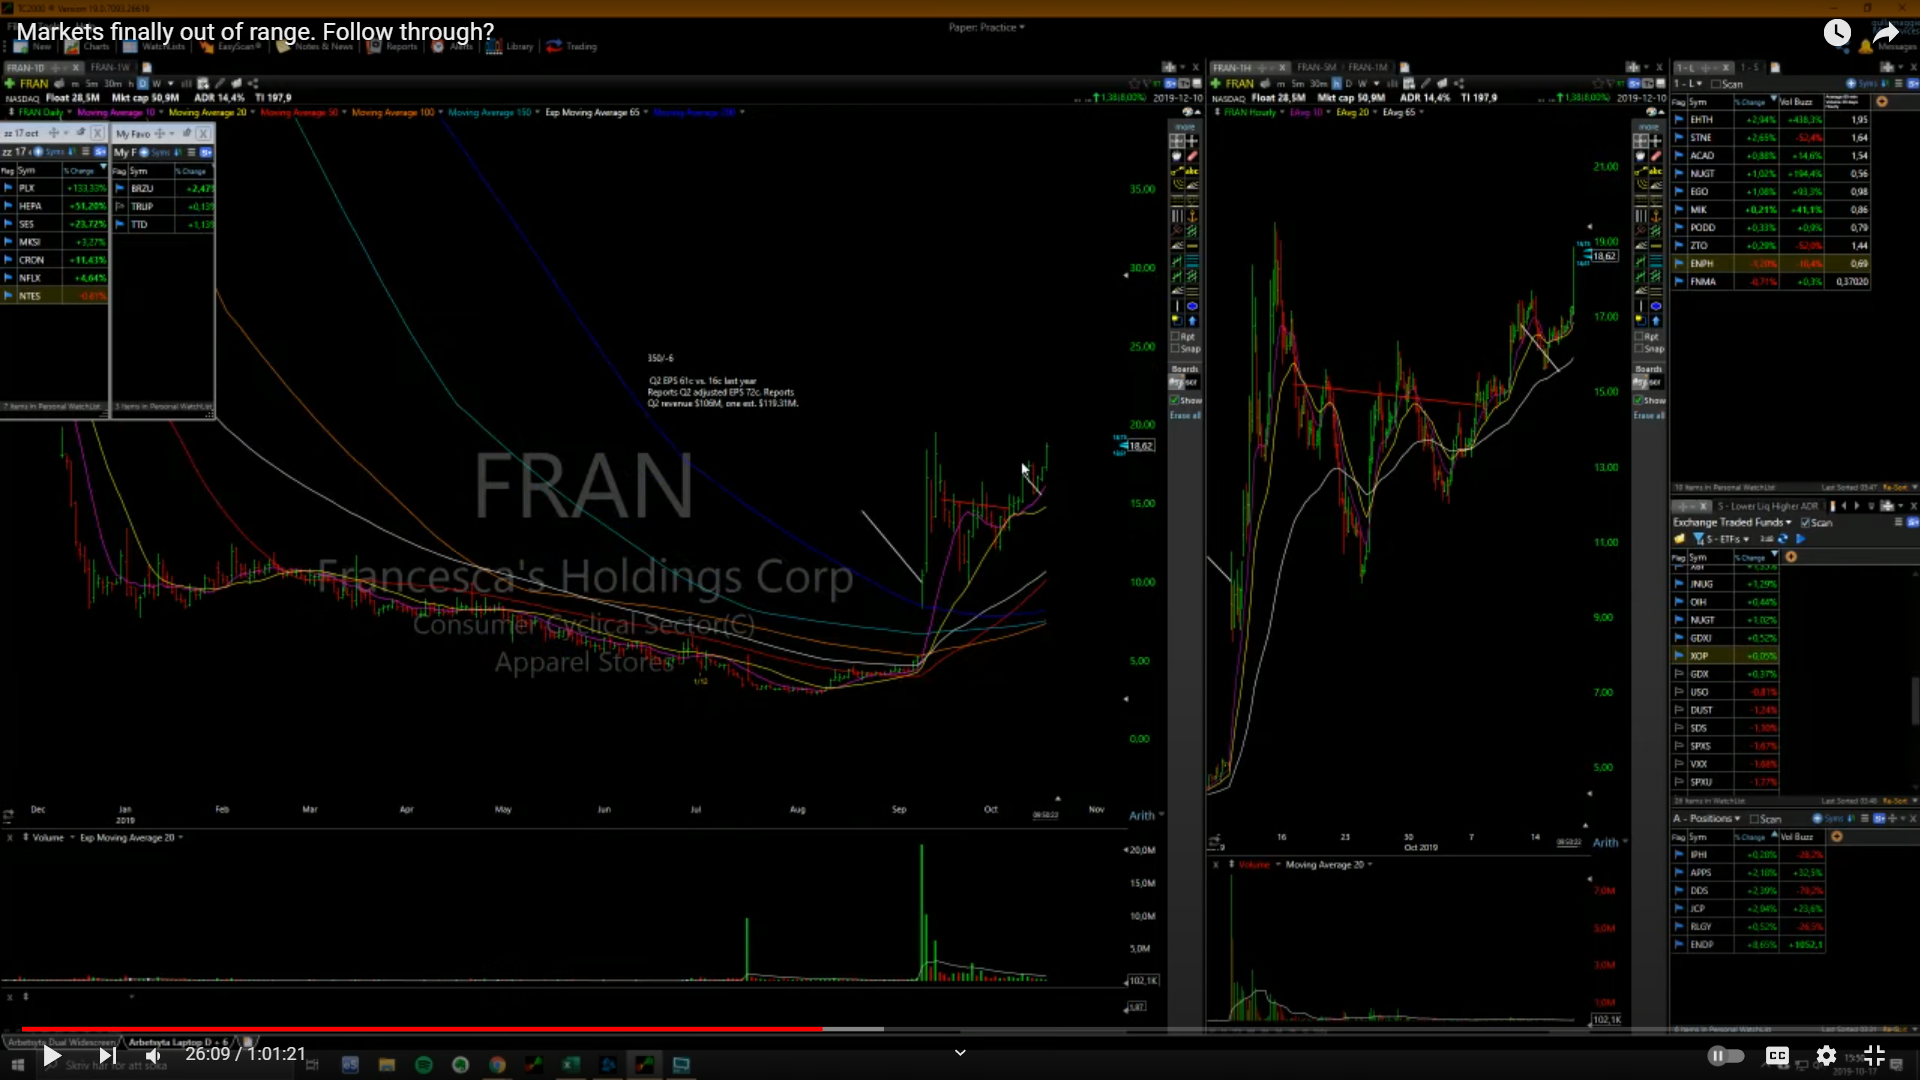 So it tripled, why can’t it double from this pattern? So I usually well some into strength always, and then I look at where it closes, when it starts closing below certain MAs that’s when I scale out, let’s say on FRAN if I bought this breakout here, I would probably have sold maybe 20/25% and then have a b/e stop, and then if it closes below the 10day I would sell out 1/4 or 1/3, and if it closes below the 20day I would close out another 1/4 or 1/3, that’s how I scale out. But it also depends on the stock, these kinda faster stocks you prob have to use the 10/20day, when this thing hits the 50day it’s prob gonna be down 50% from the highs.
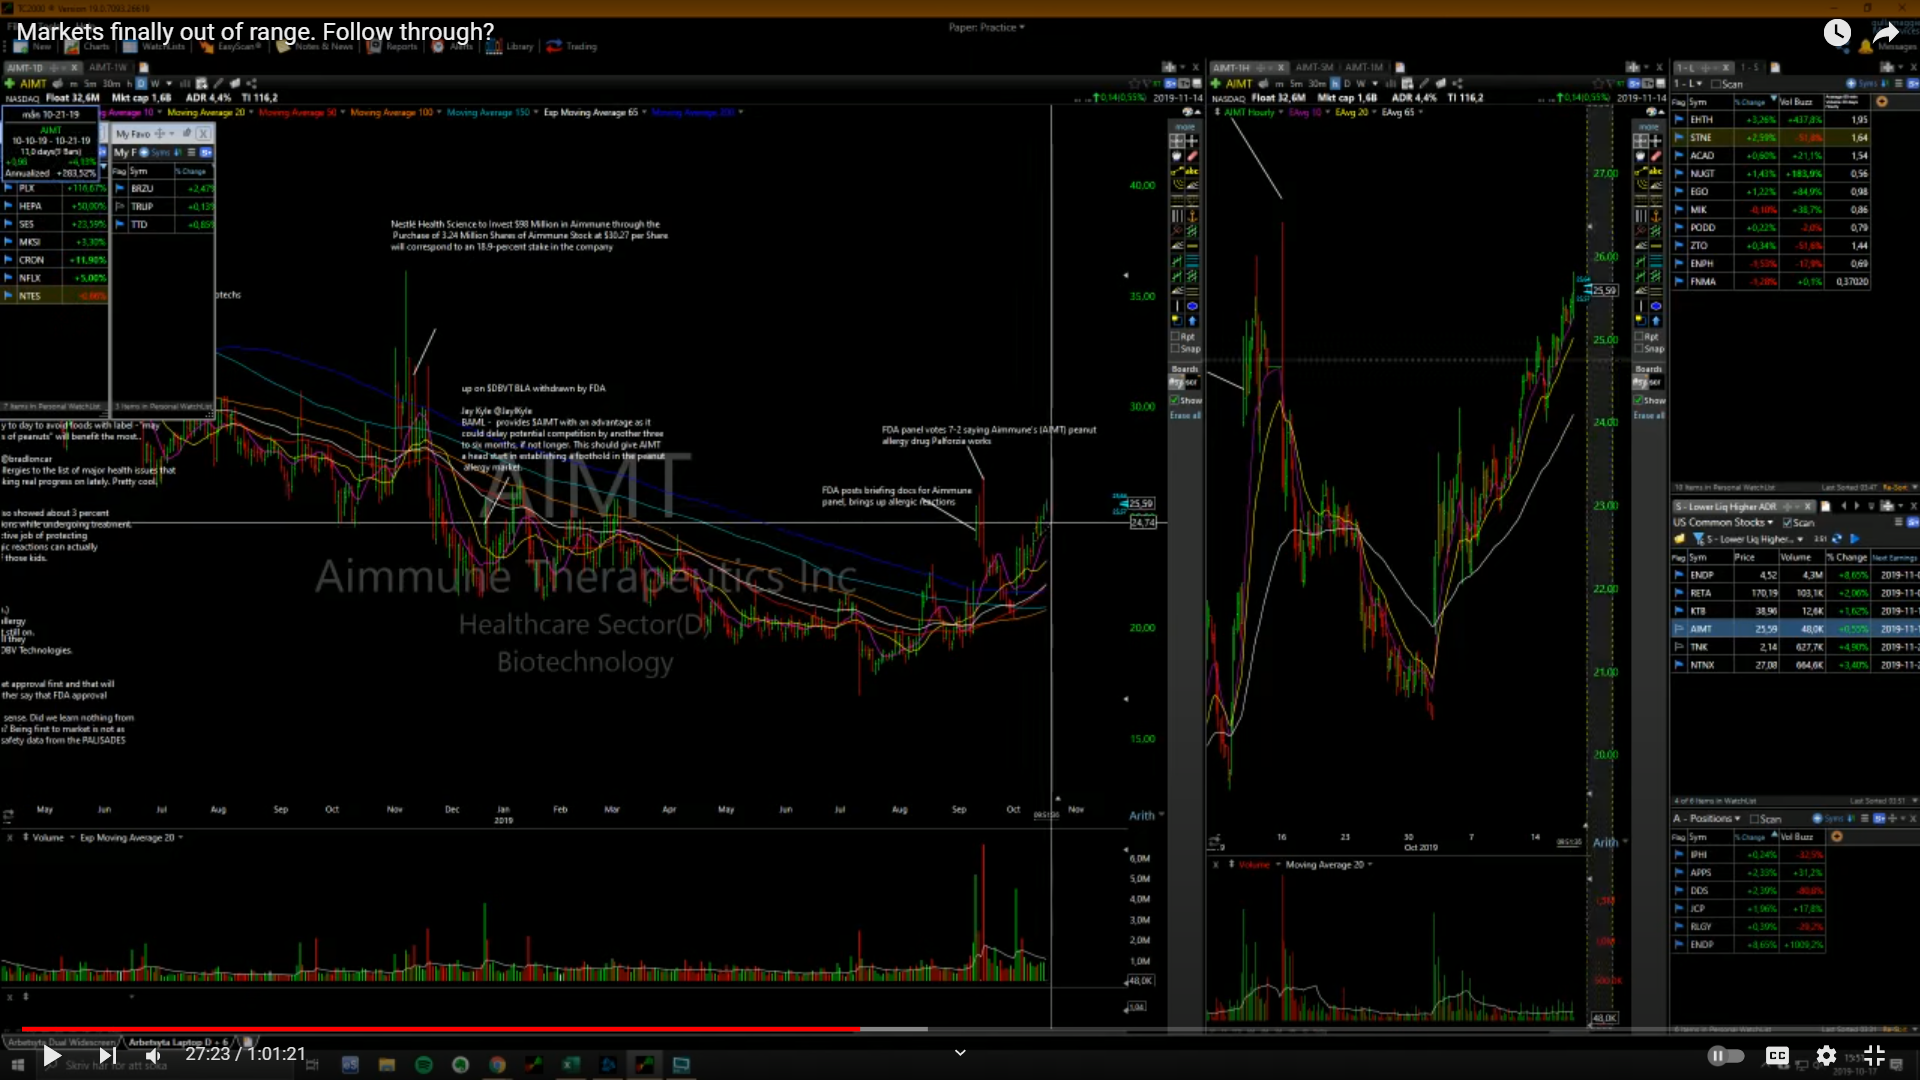
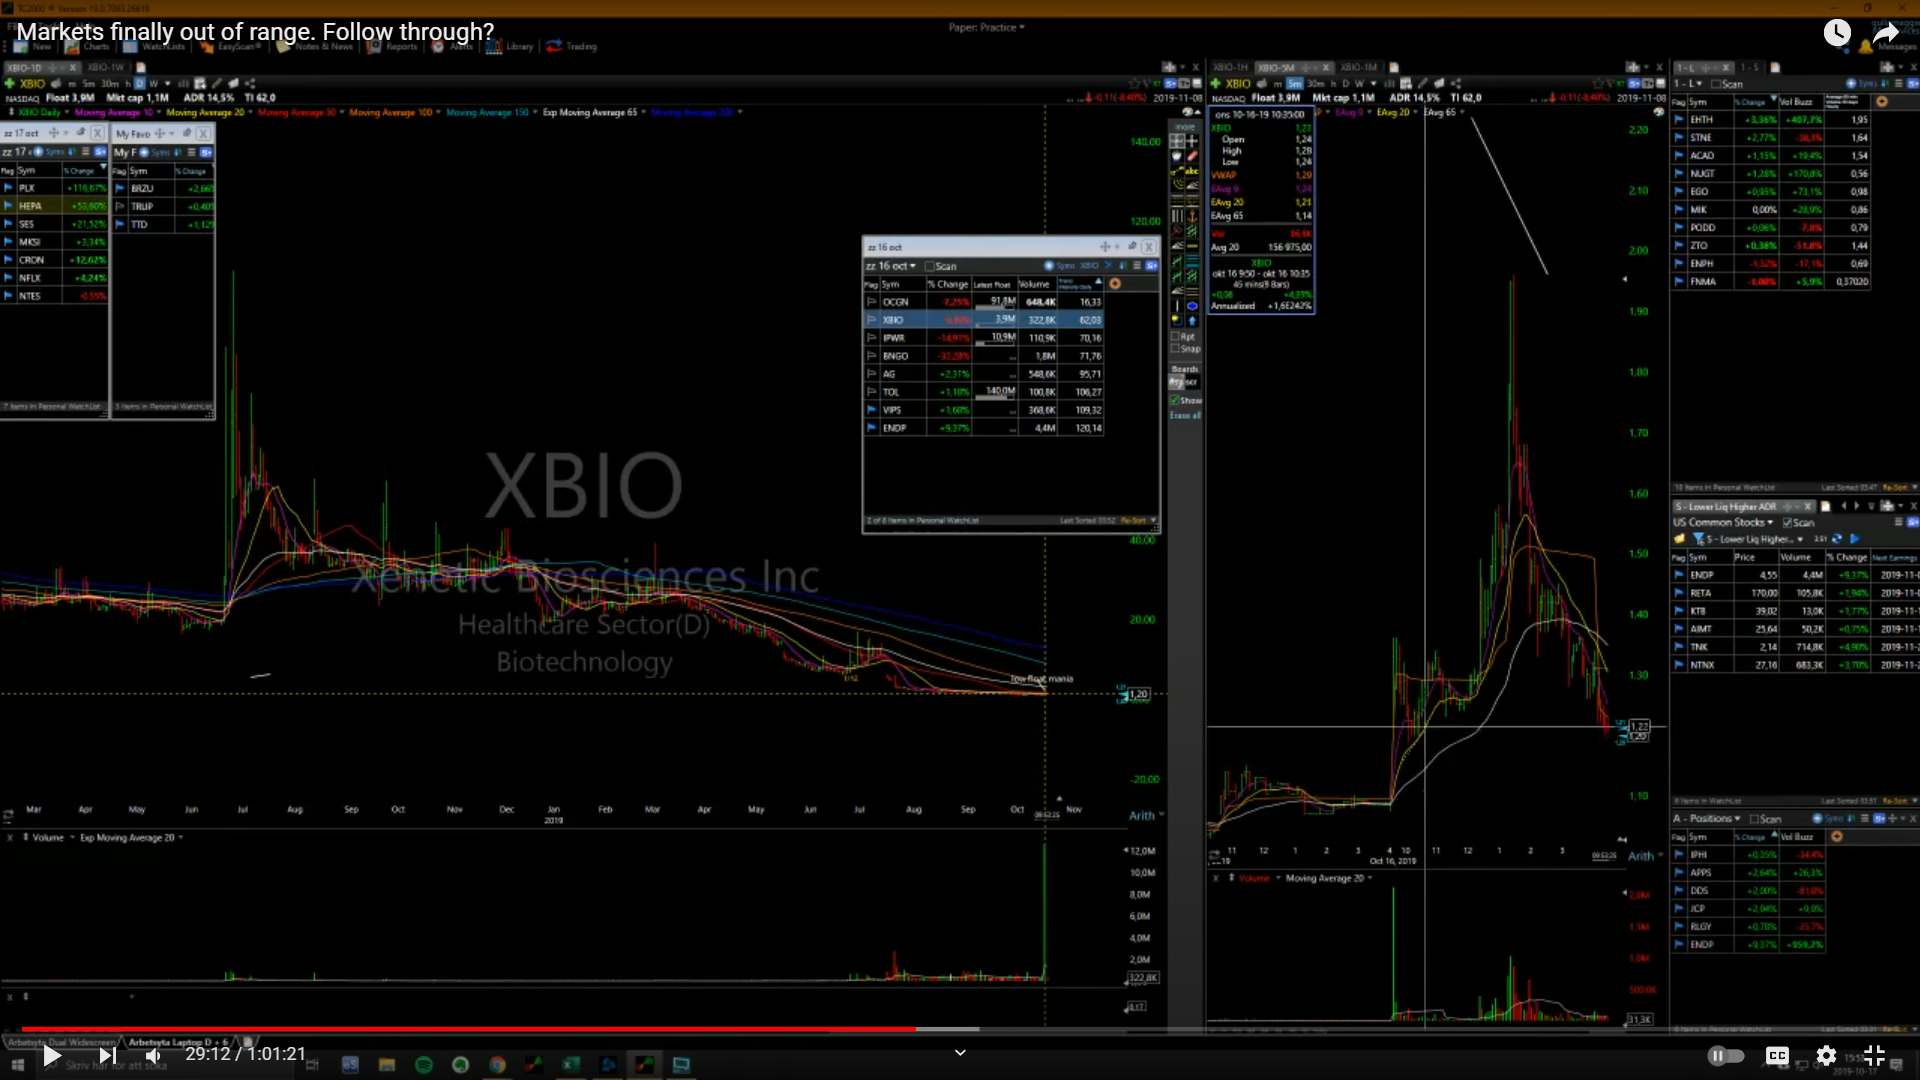 These patterns happen on all time frames, daily, intraday, weekly, these flag patterns are very powerful. The more powerful the first leg higher is, the more powerful the next leg higher is going to be most of the time.
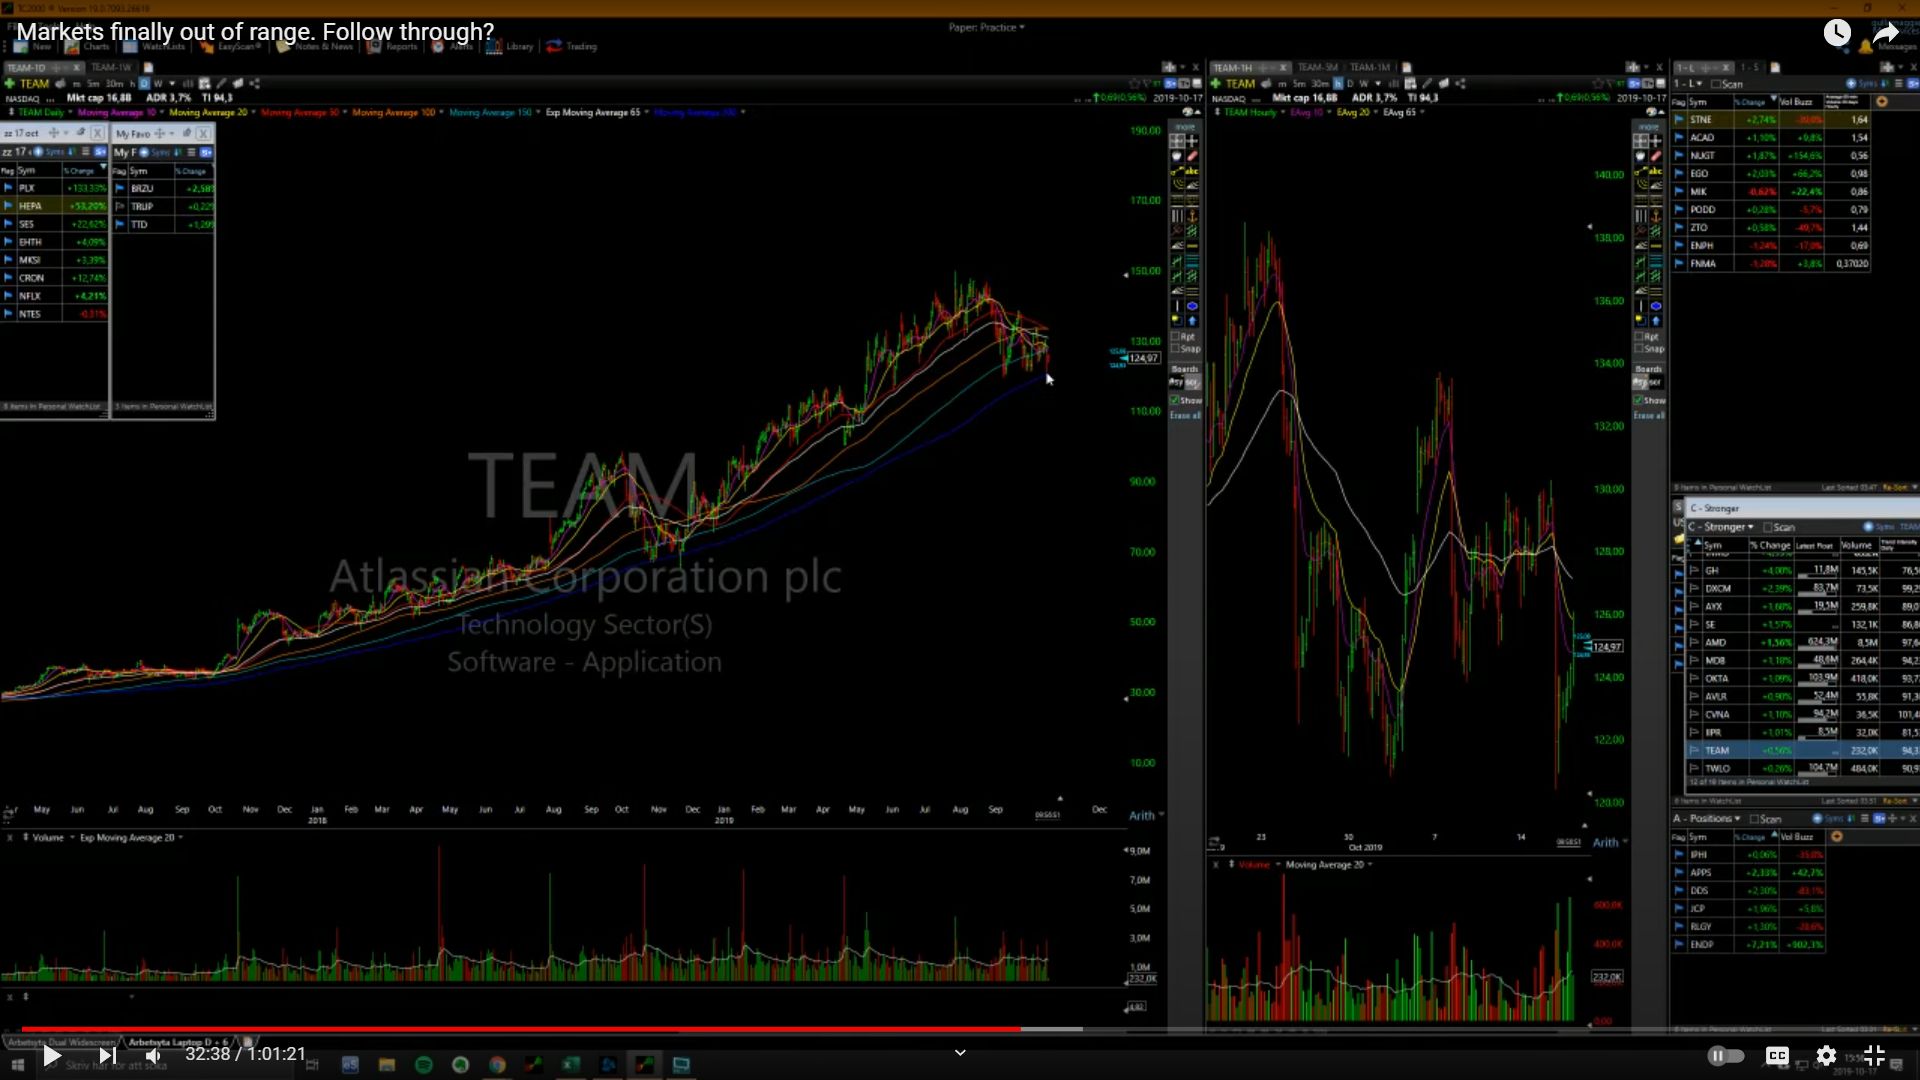
 Same with the SPYs, had this big washout, sentiment down here late Dec2018 was as bearish or even more than the sentiment was in 2008, just insane, then it had a big rally and getting tighter and tighter.
 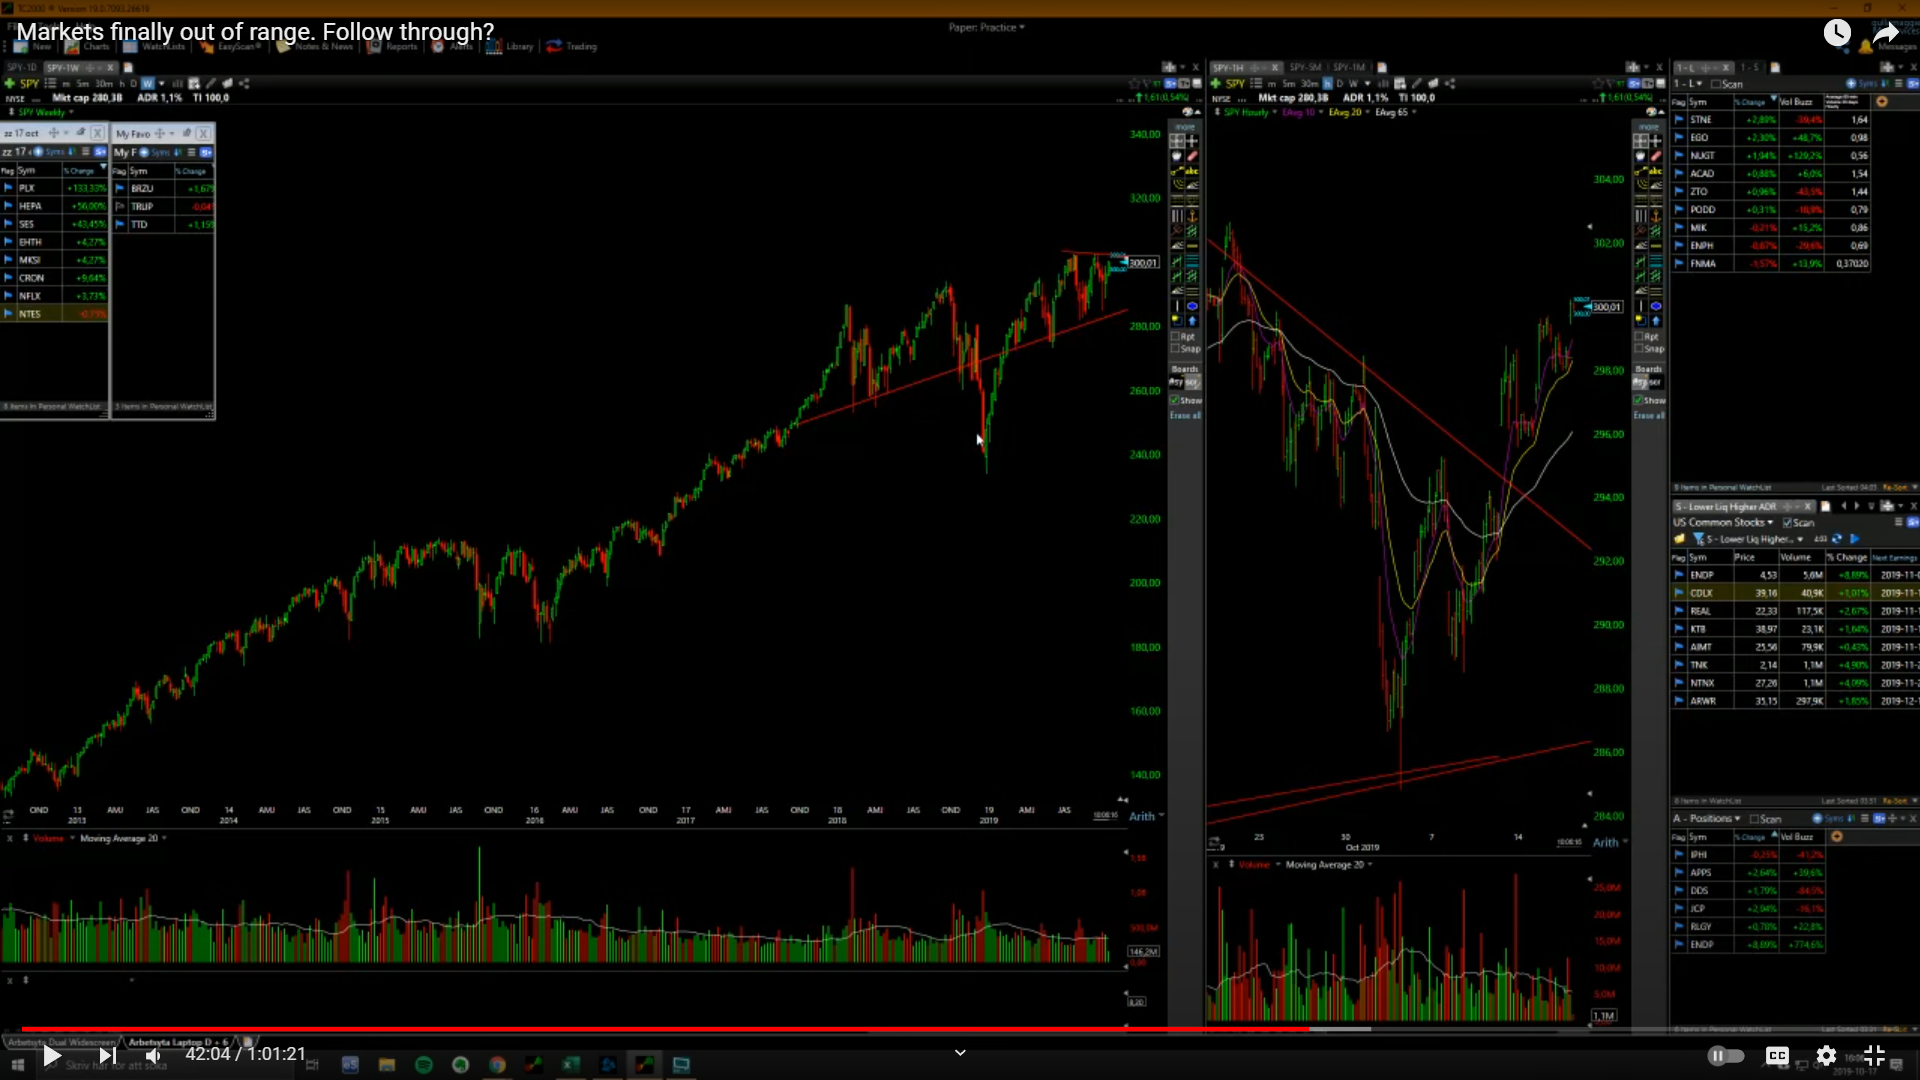 IWM not as good but been going sideways for a long time, just in this channel.
 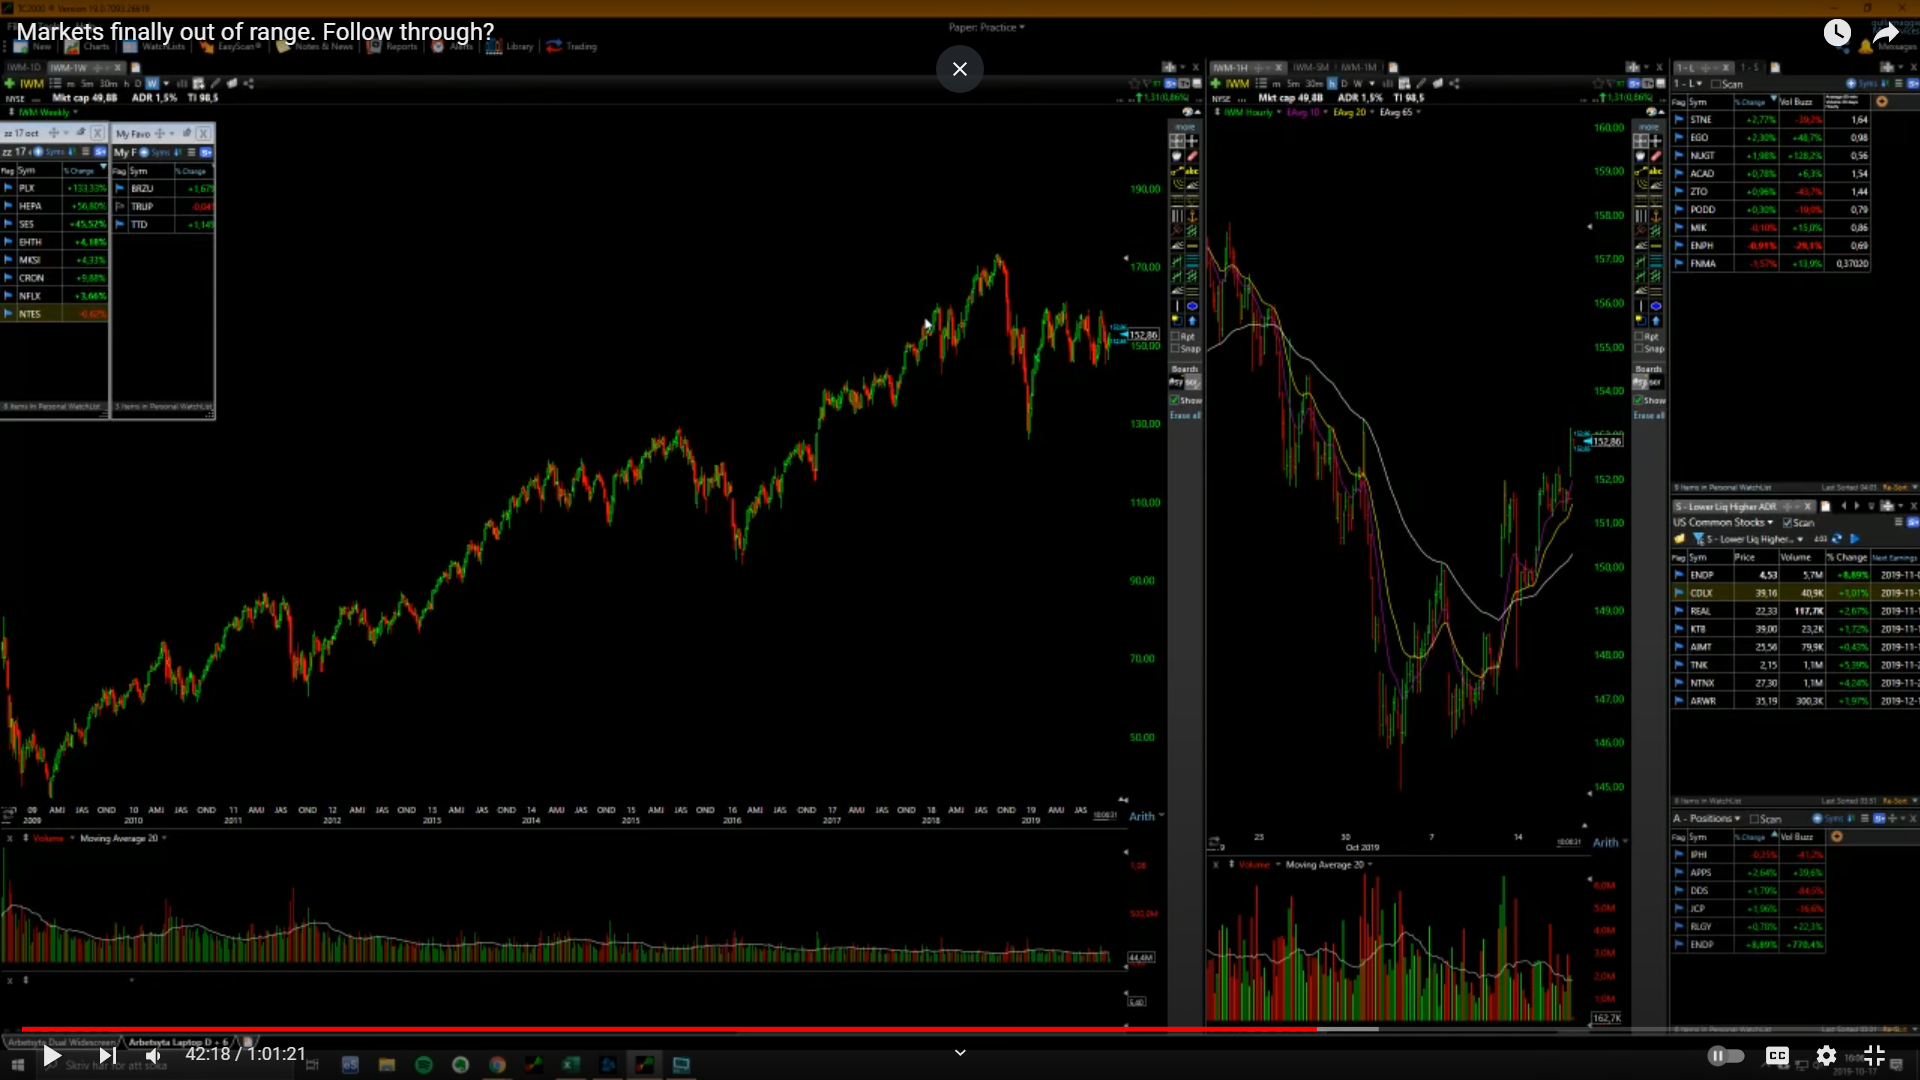 ASHR looks great, look at the China stocks, looks bullish hls, potential range break coming up.
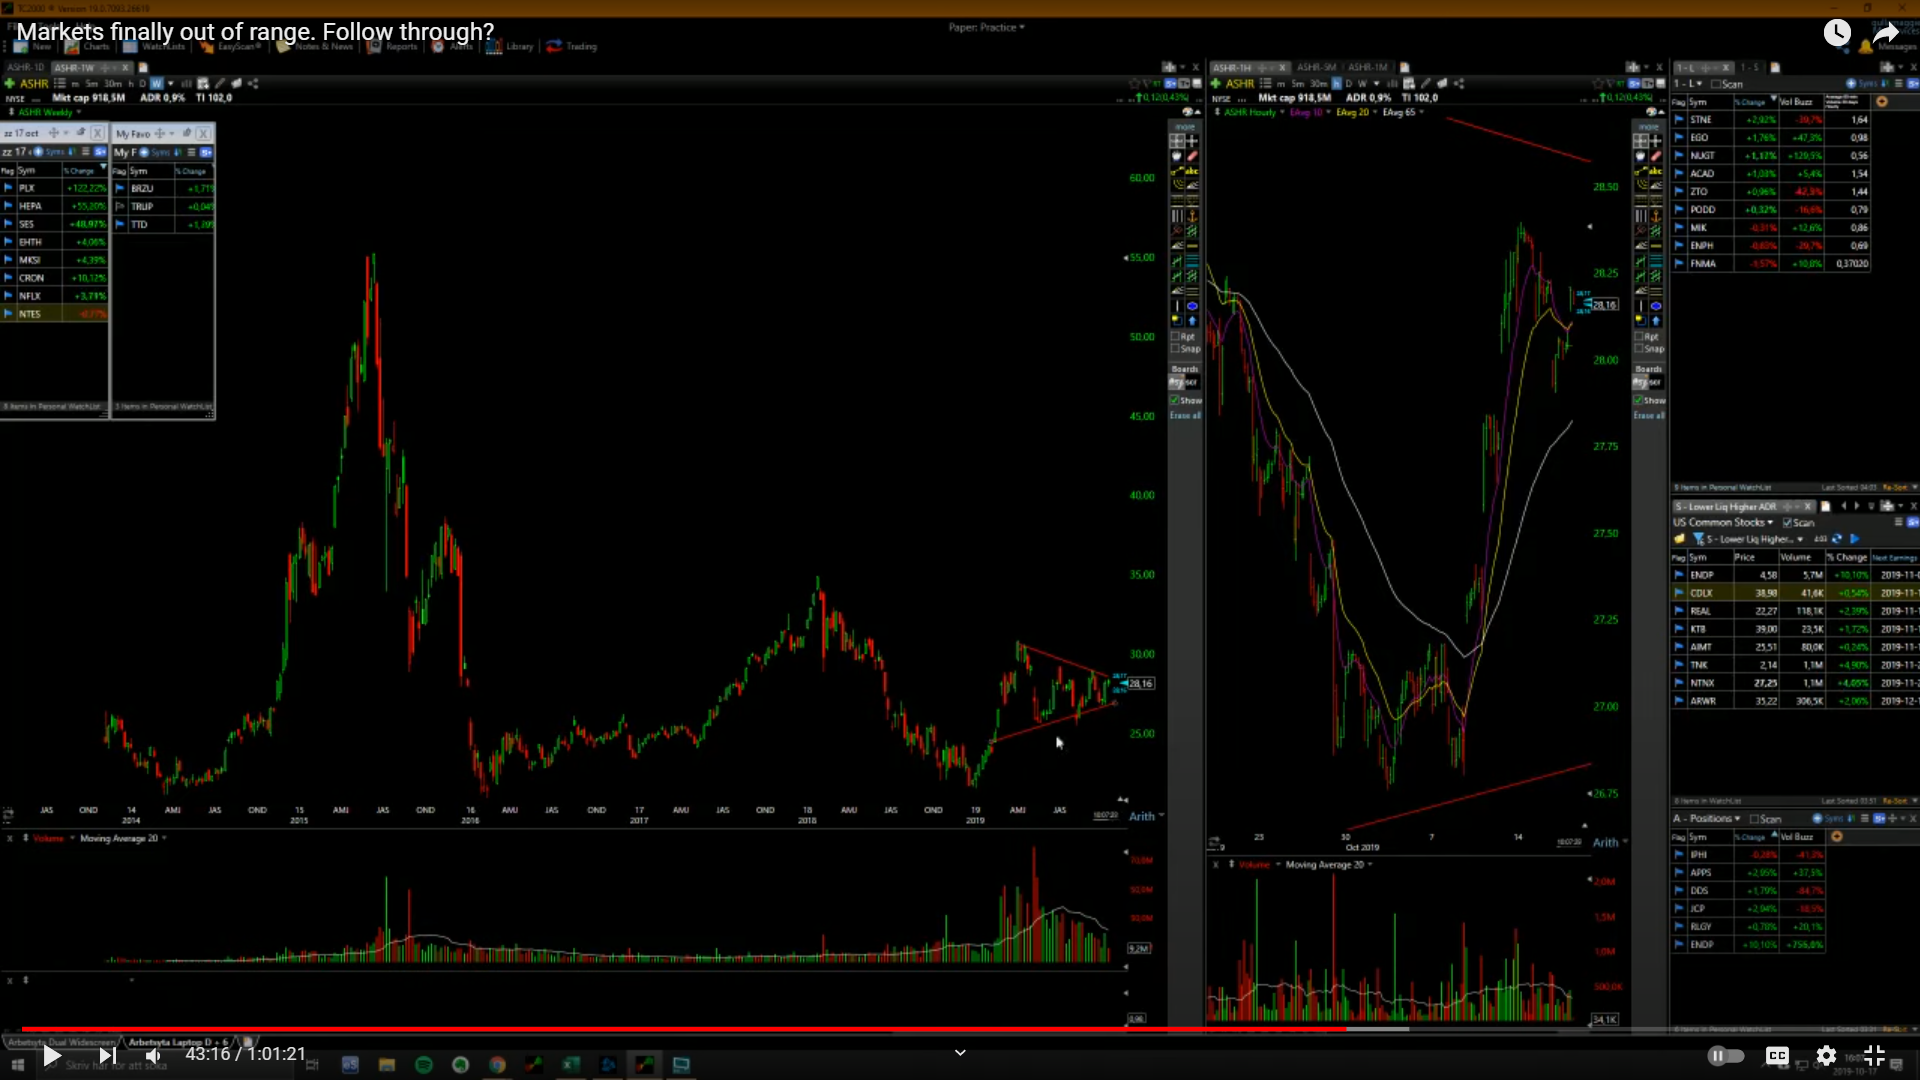
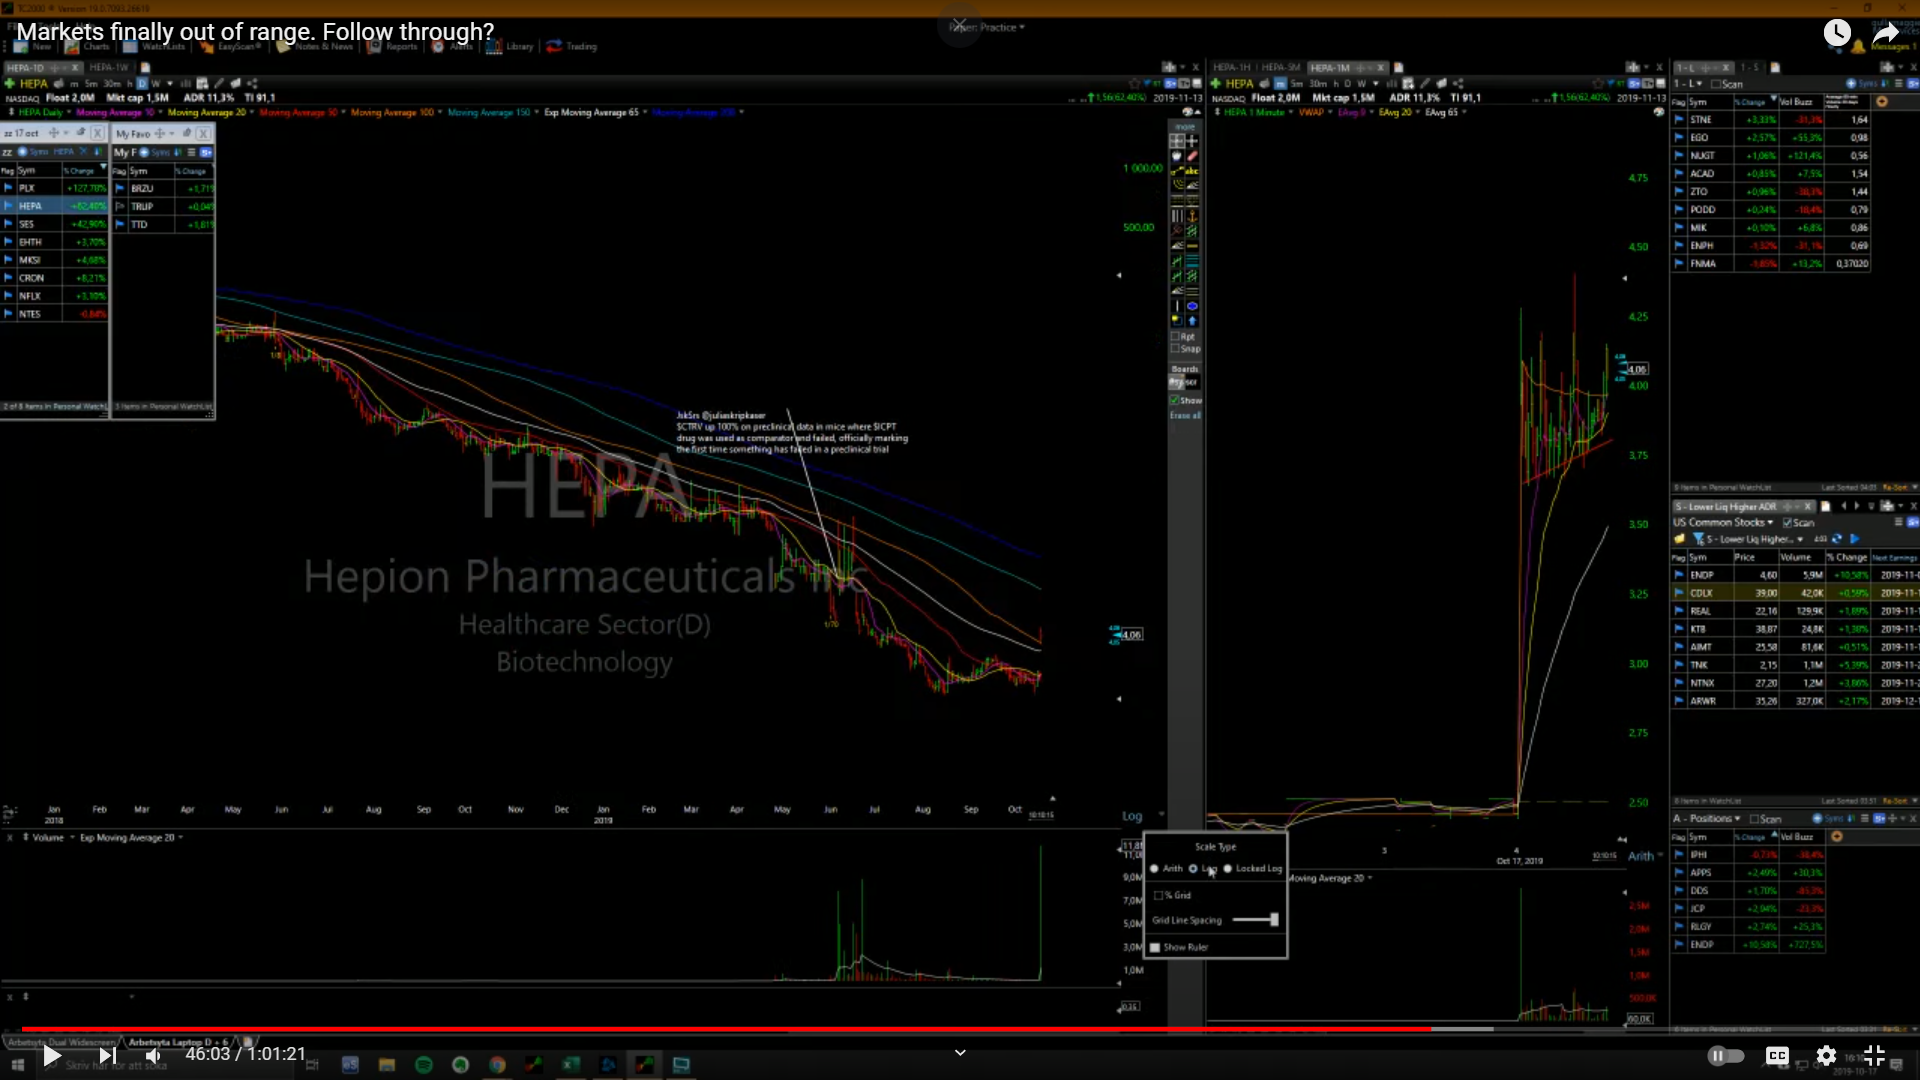 Idk what’s the news, okay it’s mice data, that’s totally worthless. I was a little bit tempted buying here in this this 4.10s area but now I don’t wanna chase it up here, but yeah when it reclaimed vwap for like the 10th time with hls, on this candle, if I had seen it down here I would have bought like 30kshares, in case it does go up 50% from here, now it’s just chasing could very easily slam down. Omg HEPA was at 5.80 premarket I didn’t see that, so it faded from 5.80 to 3.45 premarket. HEPA going, gonna go to 6, there is definitely opps in this market, so I missed some I was a little bit too late.