I have a few basic setups that I trade over and over and over again.
Parabolic short. It’s a stock that gets very extended in a short amount of time. So there’s two components to it, you have a percentage move, preferably 200/300% or maybe even 1000%+ in a short amount of time like 3/5days, 2weeks or something. So it goes up alot in a short amount of time, and preferably it goes up on nothing, some speculation or hype or just a pure pump.
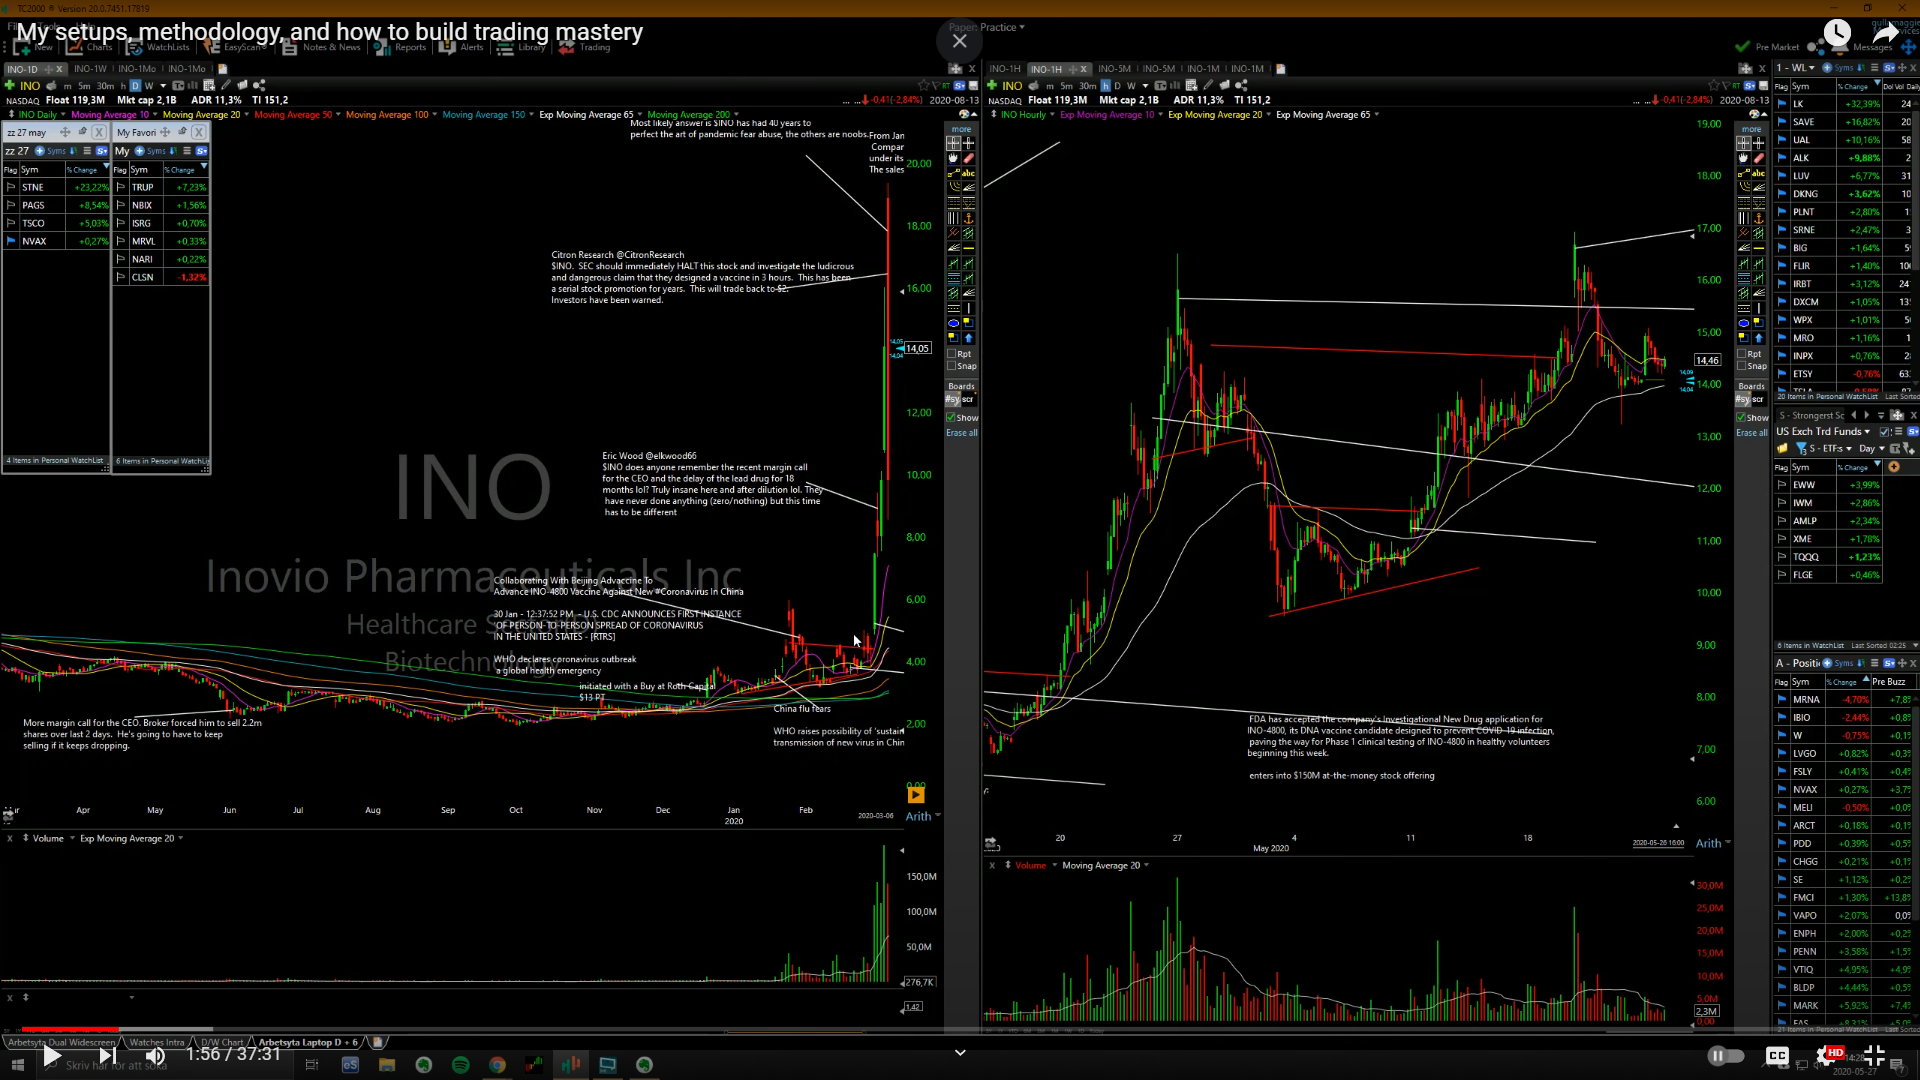
INO for example, this is what you’re looking for. Something that’s just straight up, with no dips, this thing went up 300% in 5 sessions. 5th day, and this is important you have to wait, you can’t short on the 1st or 2nd day generally, sometimes it works but I prefer to wait for stocks that go up 3/4/5 days those are the best ones. You want to be in a position of strength, you don’t want to be shorting it down here because you think it’s a piece of sh*t pump and it’s up too much, you don’t wanna short it on day1 or day2. This stock, 5th day, big euphoric gap up, then it just tanks. It had a bit of a push out of the gate, and then it took out orls, now this is key, I talk a lot about orhs and orls, and I trade them all the time. If I want to short orls is usually where I want to short. Orls can be the 1min, 5min or hourly candle.
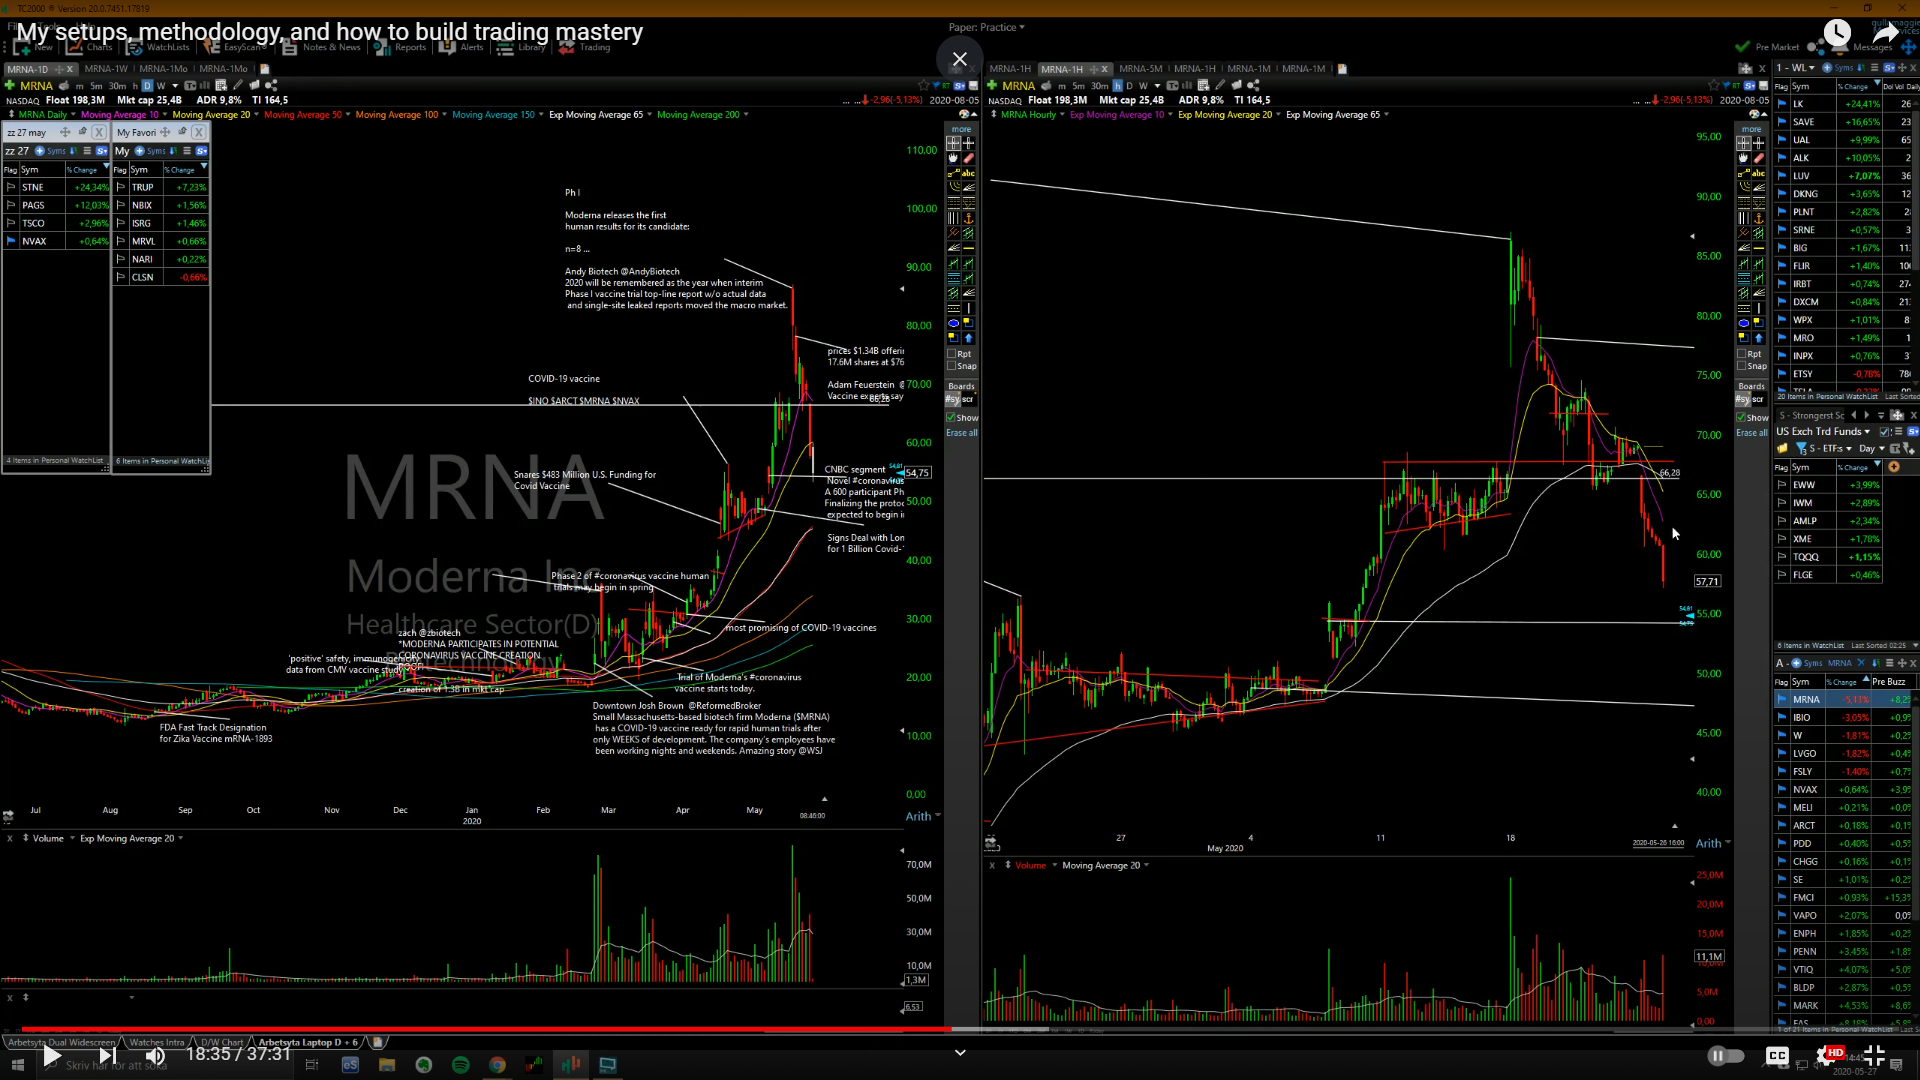
A recent example, MRNA. This one wasn’t an orls play, it was still a range break, I also talk a lot about tight ranges. So MRNA was another candidate, it’s been up 500%, it’s a largecap stock, 500% in 6 months for a large cap stock, that’s a big move. A lot of hype and speculation with their vax etc. They had kinda decent data on this day here, only from 8 patients so it was kinda irrelevant, the stock was already extended. So this one I was stalking for a good r/r setup. It went in a tight tight range, then late day started failing. Tight range, risk $2 to make potentially $20 to the downside, that’s exactly what happened, just straight down from there. This was another extended stock, but it wasn’t up 3/4 days in a row, it had just been flagging for a week, and then it gapped up on this news, but it was already pretty overextended.
So similar setup to INO but MRNA wasn’t straight up as violently. They key in both of these is you don’t randomly short them, you wait for them to start going lower. You don’t start randomly picking tops, you wait for weakness. So that’s why you wait for these orls, or mid/late day fades. So it’s kinda the same trade, but a variation of the same trade.
INO also had a similar setup in April2020. It went up 100% in just 5/6 sessions, and then you had this bit of a peak day. You can pretty much count the days, 1,2,3,4, even if this day was red the stock was higher on this day so you count this as an up day, so 7 days, then you get this reversal. And it’s this same thing, orls is the key. So you wait for orls, stock has been straight up, then it triggers, tries to bounce. I’m gonna introduce you to another indicator vwap. I only use this when I’m shorting stocks pretty much, or when I play mean reversion trades on the long side, only when I do bounce plays. So it tests vwap, can’t get above, holds below vwap, midday, built a range for several hours, then it breaks below that, then it just fades straight down.
So let’s look at some mean reversion long trades. GBTC 2017. This is similar to the short setup, mean reversion parabolic short, this is a parabolic long. Same concept, you have a stock that’s down 40/50/60% in this case 70% in 4 sessions. 4th day, gaps down big, has a wash out, goes a bit lower from the open, then it’s the same thing. Reclaims vwap, holds above, puts in orhs, that’s when you go long, when it starts proving itself. Then it bounced, the high here was 110% in 2 days. You want to find these stocks with big big ranges, that’s where the big money is.
So GBTC was a little bit choppy intraday, weak at first, gapped down, then it went straight up, reclaimed vwap, actually took out prev day highs, then midday it peaked, went below vwap, retested then it started failing, that’s when you have a set r/r. A lot of stocks they start fading mid/late day, these momo stocks, that’s where you have a set r/r, you don’t have to guess where the top is gonna be, then it faded 70% in 4/5 days. Now this day here is the bounce, so it’s like you flipped the chart, same trade but on the long side. It’s extended to the downside, puts in the first green candle. This is something I talk about, the first green or first red candle, if you have something going straight up or down, in this case you wait for the first green 5min candle before you buy, then you can use the low of that candle as your stop. So takes out that candle, add a little bit, takes out orhs, add some more, then it goes straight up, then the next day it went up another 20/30%.
Another setup I trade is breakouts and earnings gappers. This TDOC, good earnings report, they beat both eps rev, guided higher, and the stock gaps up and goes up on big volume. Takes out a long multiyear range. Look on the weekly chart, building hls for a over a year, took out a range, this is a growth stock, right sector, right business, things are going well, this is why the stock is straight up since 2016. Then they gap up on a big earnings report, this is what started the big move, went up 160% in a few months.
Another example DXCM, very similar chart. Wait for a long range break, it needs to gap up on good earnings, beat the analyst estimates, have good growth numbers. Eps grew by 261% yoy and rev grew 49%, this is a growth stock. Estimates were 156% for this year and 54% for next year, so they were going to keep growing. And it went straight up. Higher lows for 6 months, year long range, then it gaps up on good earnings, beat estimates etc etc.
MRNA, I’m still short this thing, so I’ve been adding on the 60min ranges, for e.g yesterday, it gapped down while the market was gapping up it showed rw. If you’re stalking a stock for a short and it shows rw thats a good sign and vice versa rs on the long side. So orls here I added to it yesterday.
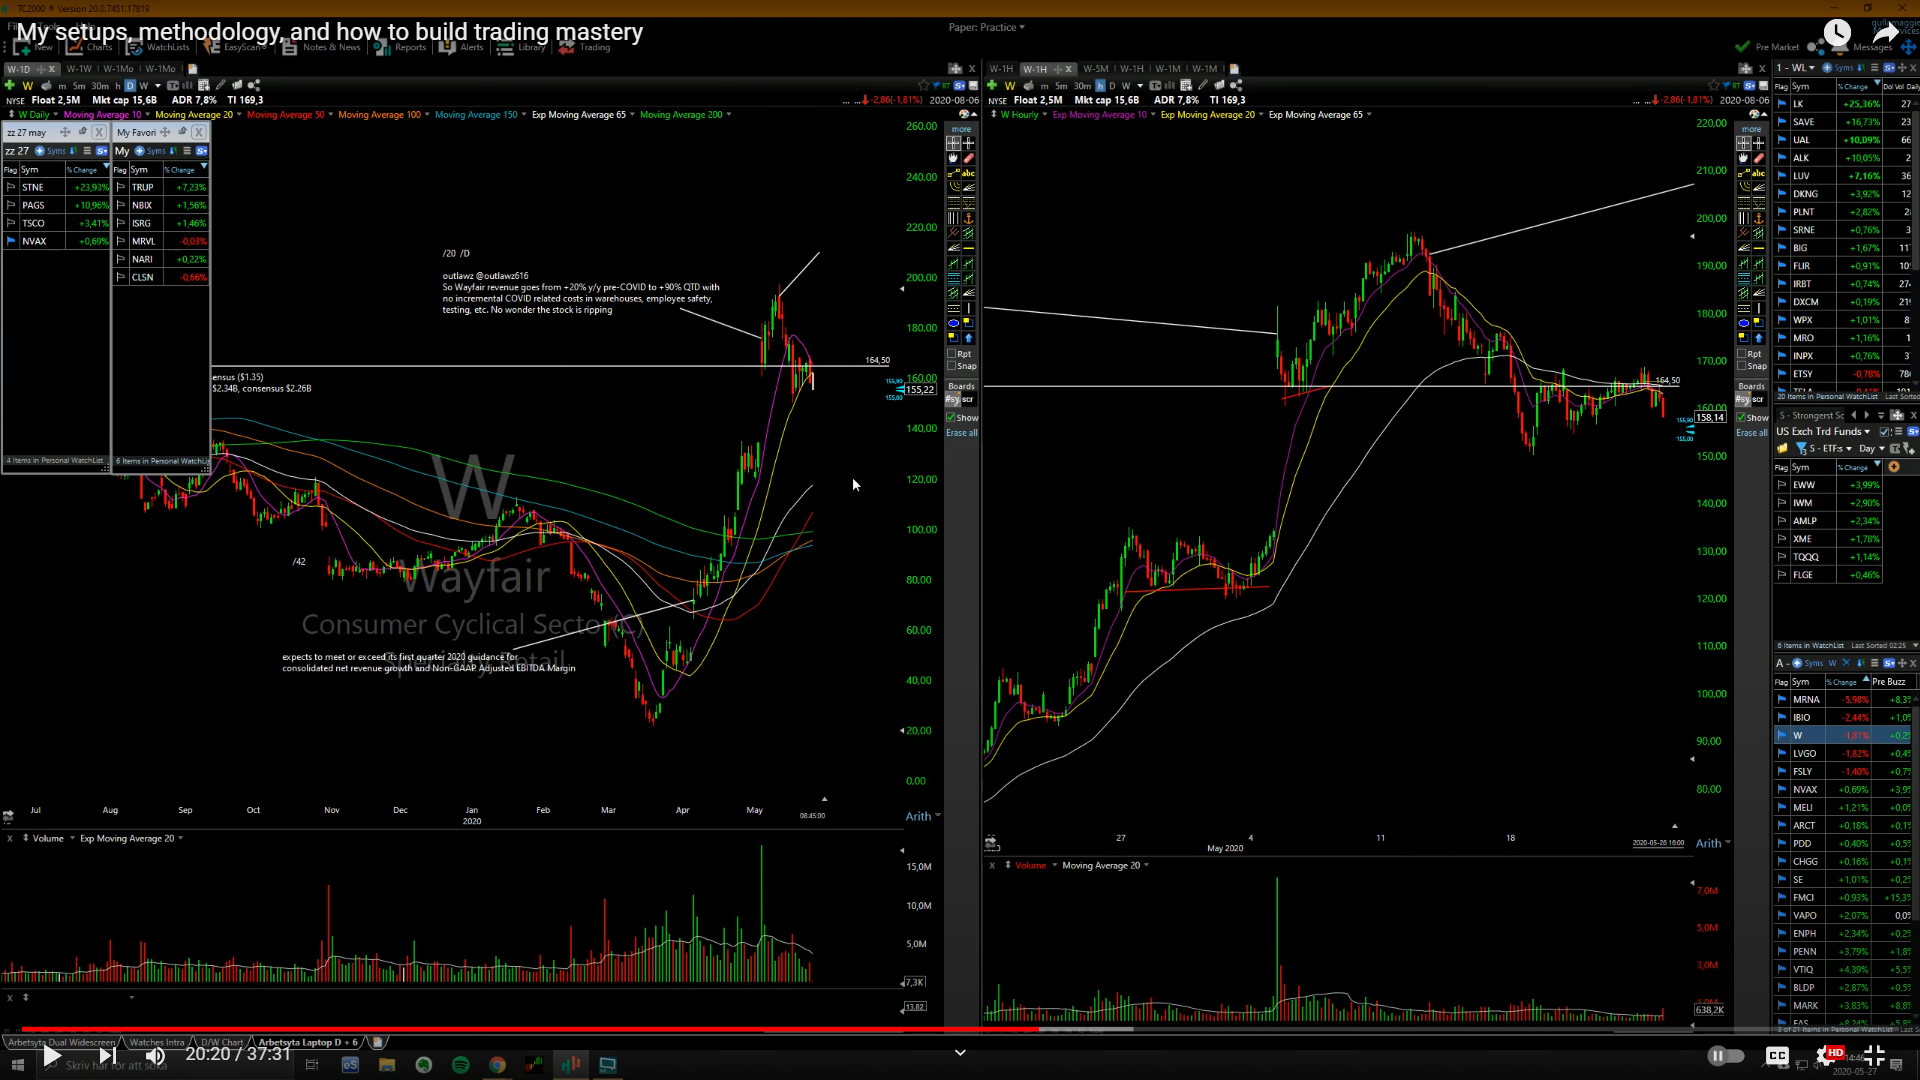
W, this one is a rangebreak from yesterday, it was up 840% in a few months, so very overextended, this is just a variation of the same setup. You wait for weakness on a very strong stock, yesterday it lost the rising20day for the first time in this whole big move, and today it’s gapping lower even though the market’s gapping higher, so it’s showing rw.
LVGO, recent ipo, bought couple months ago. Went straight down from the ipo, expensive stock, market wasn’t sure if they could sustain the growth etc. But then earnings, guided higher, stock gapped up on higher volume. Ipo breakouts can be super powerful.
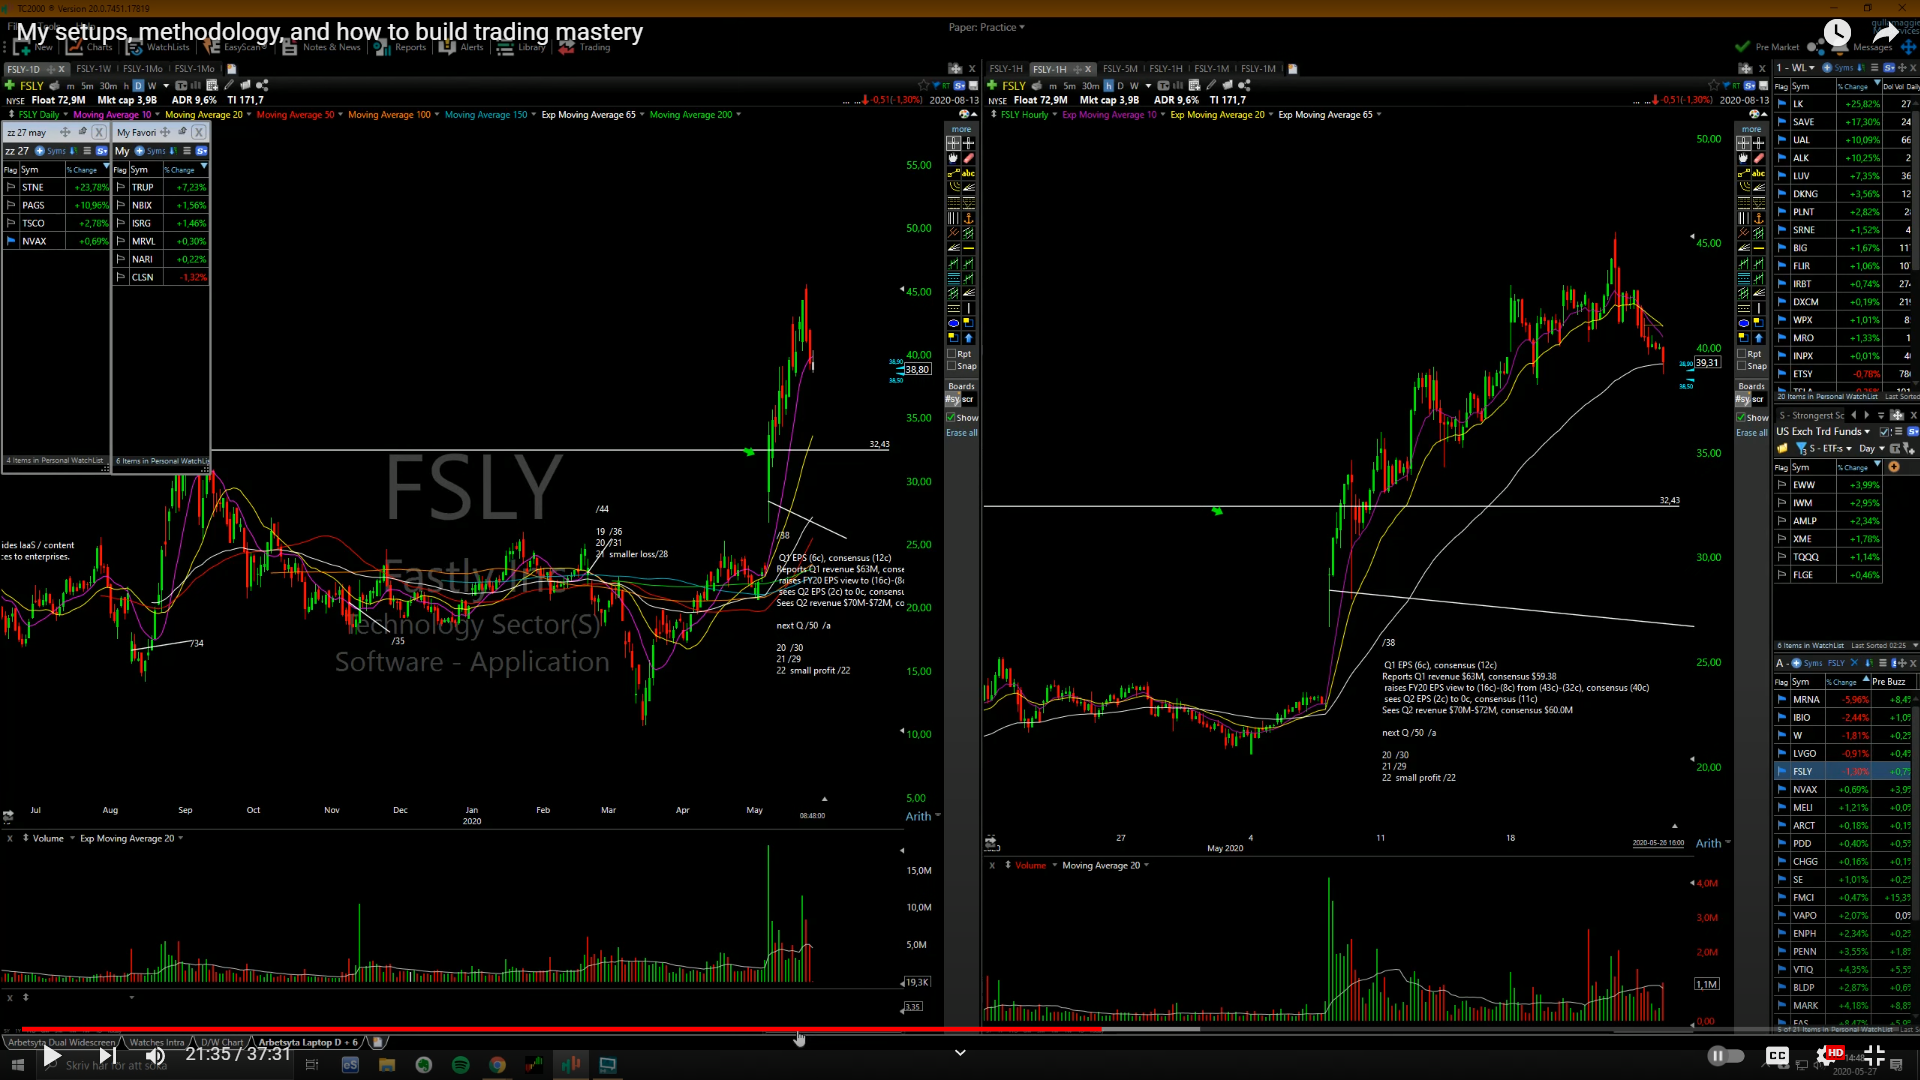
FSLY another ipo breakout, thing went sideways from ipo, then suddenly had a good report, no profits but 38% rev growth, good guidance etc. Big big volume, by far the biggest vol day, in the first 5mins you saw the vol coming in, it traded the avg day vol which is about 1.5M shares in the first 5/10mins, so was obvious pretty early it was gonna be a high volume day.
All of these trades are profitable bc I sell my losers and keep my winners. Small losses, big winners. That’s why I can be wildly profitable while being wrong 70% of the time.
You wanna be in the growth stocks, the ones that have bright futures. You don’t wanna be in something that’s negative earnings or very slow earnings growth, you want the stocks growing 30/50/100%.
The key is to trade stocks with range. I see a lot of people trading stocks with no range, no volume, in the middle of a range, there’s nothing going on and they get super excited about their stocks, I’m like.. no. Trade stocks that have volume and range, that’s where the money is.
About my scans; I scan for stocks that go up a lot. I’m pretty much scanning for stocks that are strong, bc among the strong stocks, that’s where you get the best longs and the best shorts. I also scan for losers, stocks down the most. Then I compile a watchlist each night, look through my scans and start stalking stuff. It’s always nice if the stocks you wanna go long showing rs and the stocks you wanna go short are showing rw.
If you learn these concepts you can make millions. You can make millions per year for the rest of your life. You really need to do your own research. I’ve done my research, I’ve studied 10s of thousands of stocks.You have to train your brain to recognise not only the stock patterns but also the news, and how they move in relation to each other in the market. You’ve gotta do this work yourself, no one can help you with this. This is how you build mastery. Instead of following people and begging for stock tips, you need to do the research yourself.

 Something that’s just straight up, with no dips, this thing went up 300% in 5 sessions. 5th day, and this is important you have to wait, you can’t short on the 1st or 2nd day generally, sometimes it works but I prefer to wait for stocks that go up 3/4/5 days those are the best ones. You want to be in a position of strength, you don’t want to be shorting it down here because you think it’s a piece of sh*t pump and it’s up too much, you don’t wanna short it on day1 or day2. This stock, 5th day, big euphoric gap up, then it just tanks.
 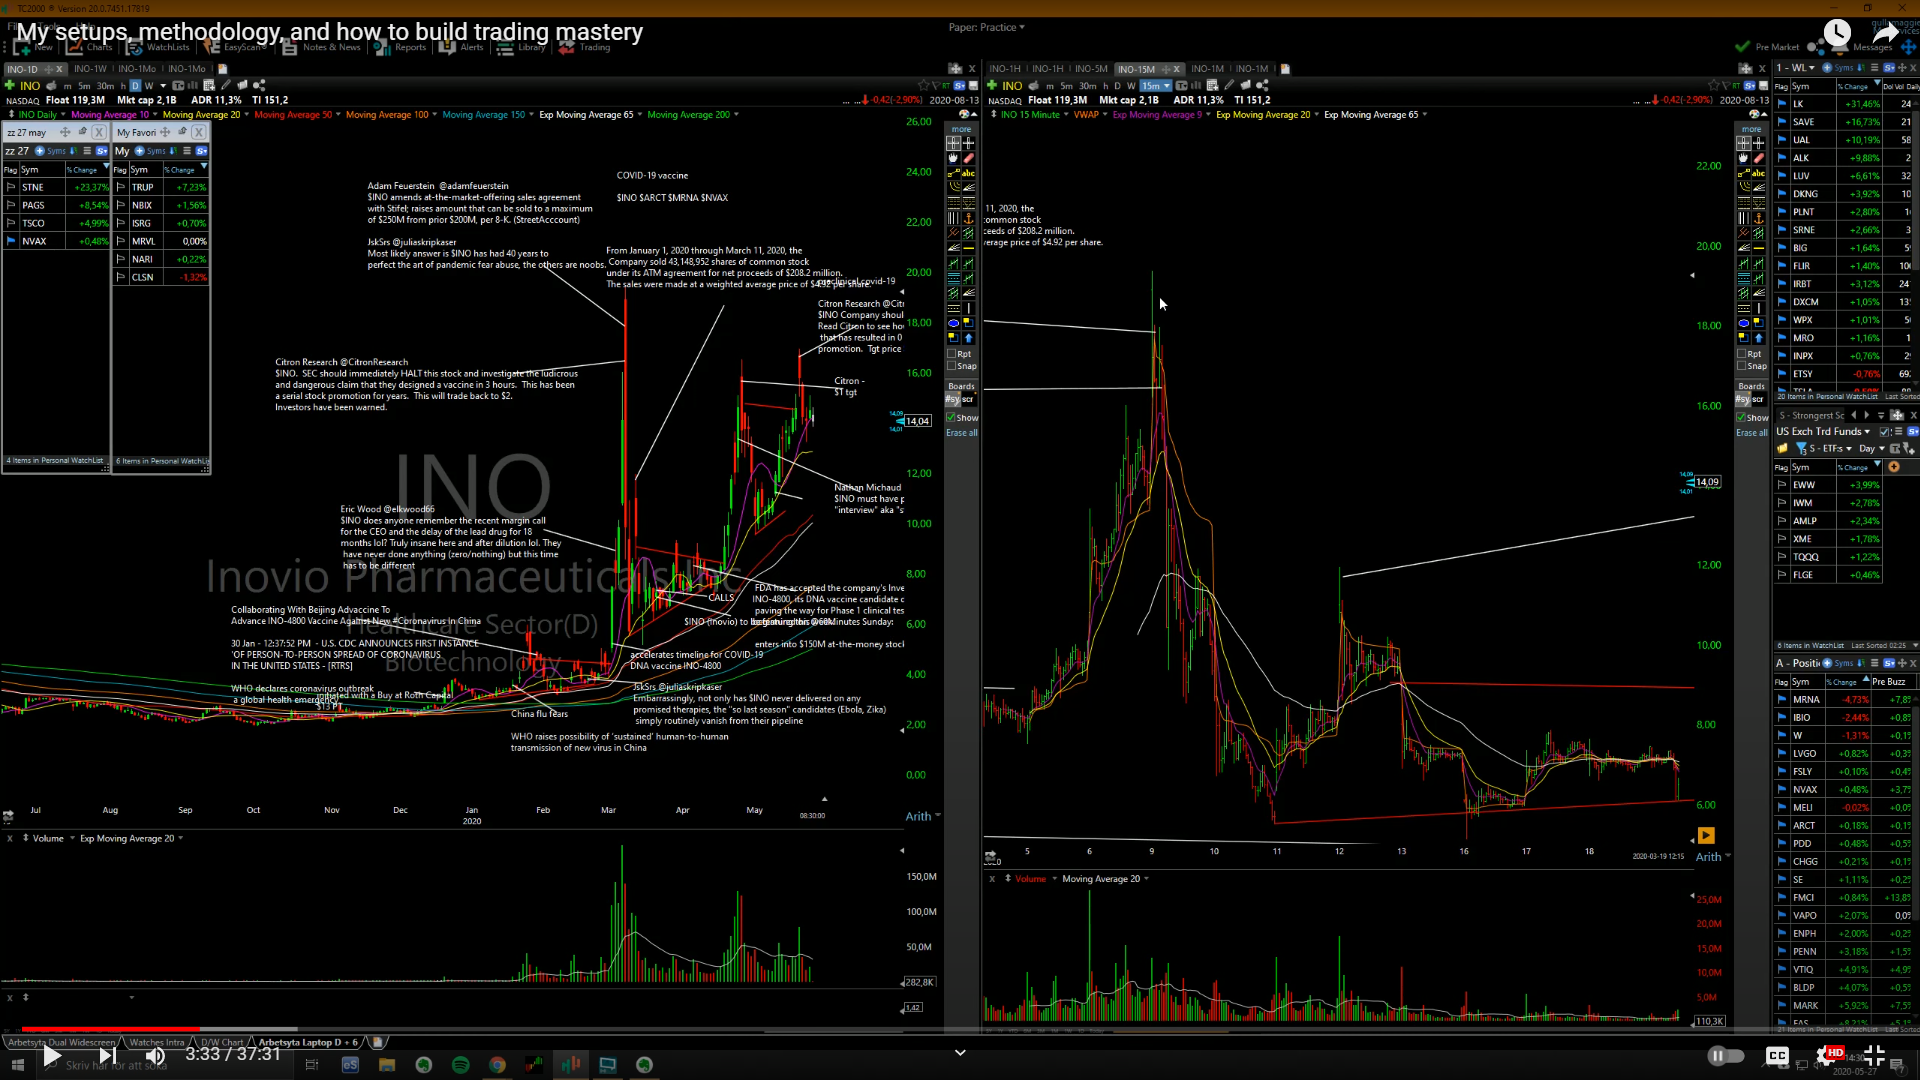 It had a bit of a push out of the gate, and then it took out orls, now this is key, I talk a lot about orhs and orls, and I trade them all the time. If I want to short orls is usually where I want to short. Orls can be the 1min, 5min or hourly candle.
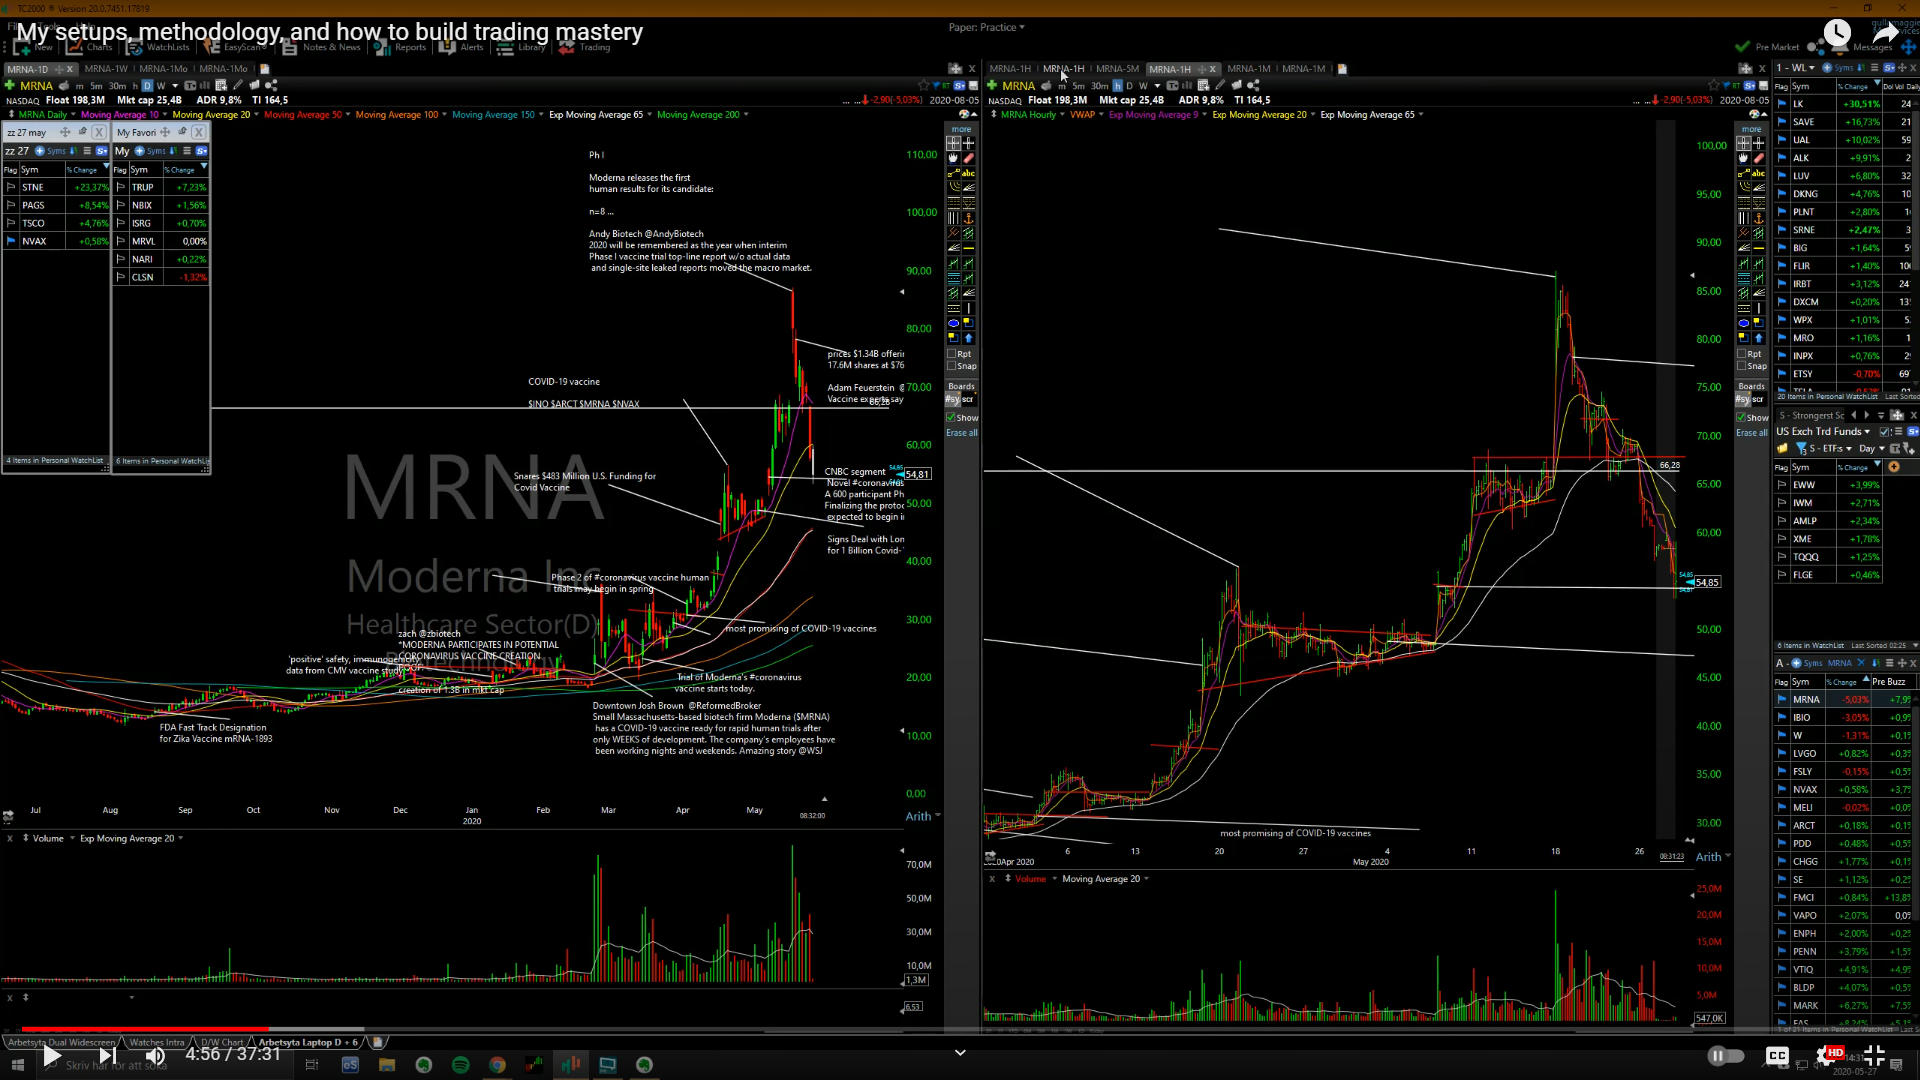 So MRNA was another candidate, it’s been up 500%, it’s a largecap stock, 500% in 6 months for a large cap stock, that’s a big move. A lot of hype and speculation with their vax etc. They had kinda decent data on this day here, only from 8 patients so it was kinda irrelevant, the stock was already extended.
 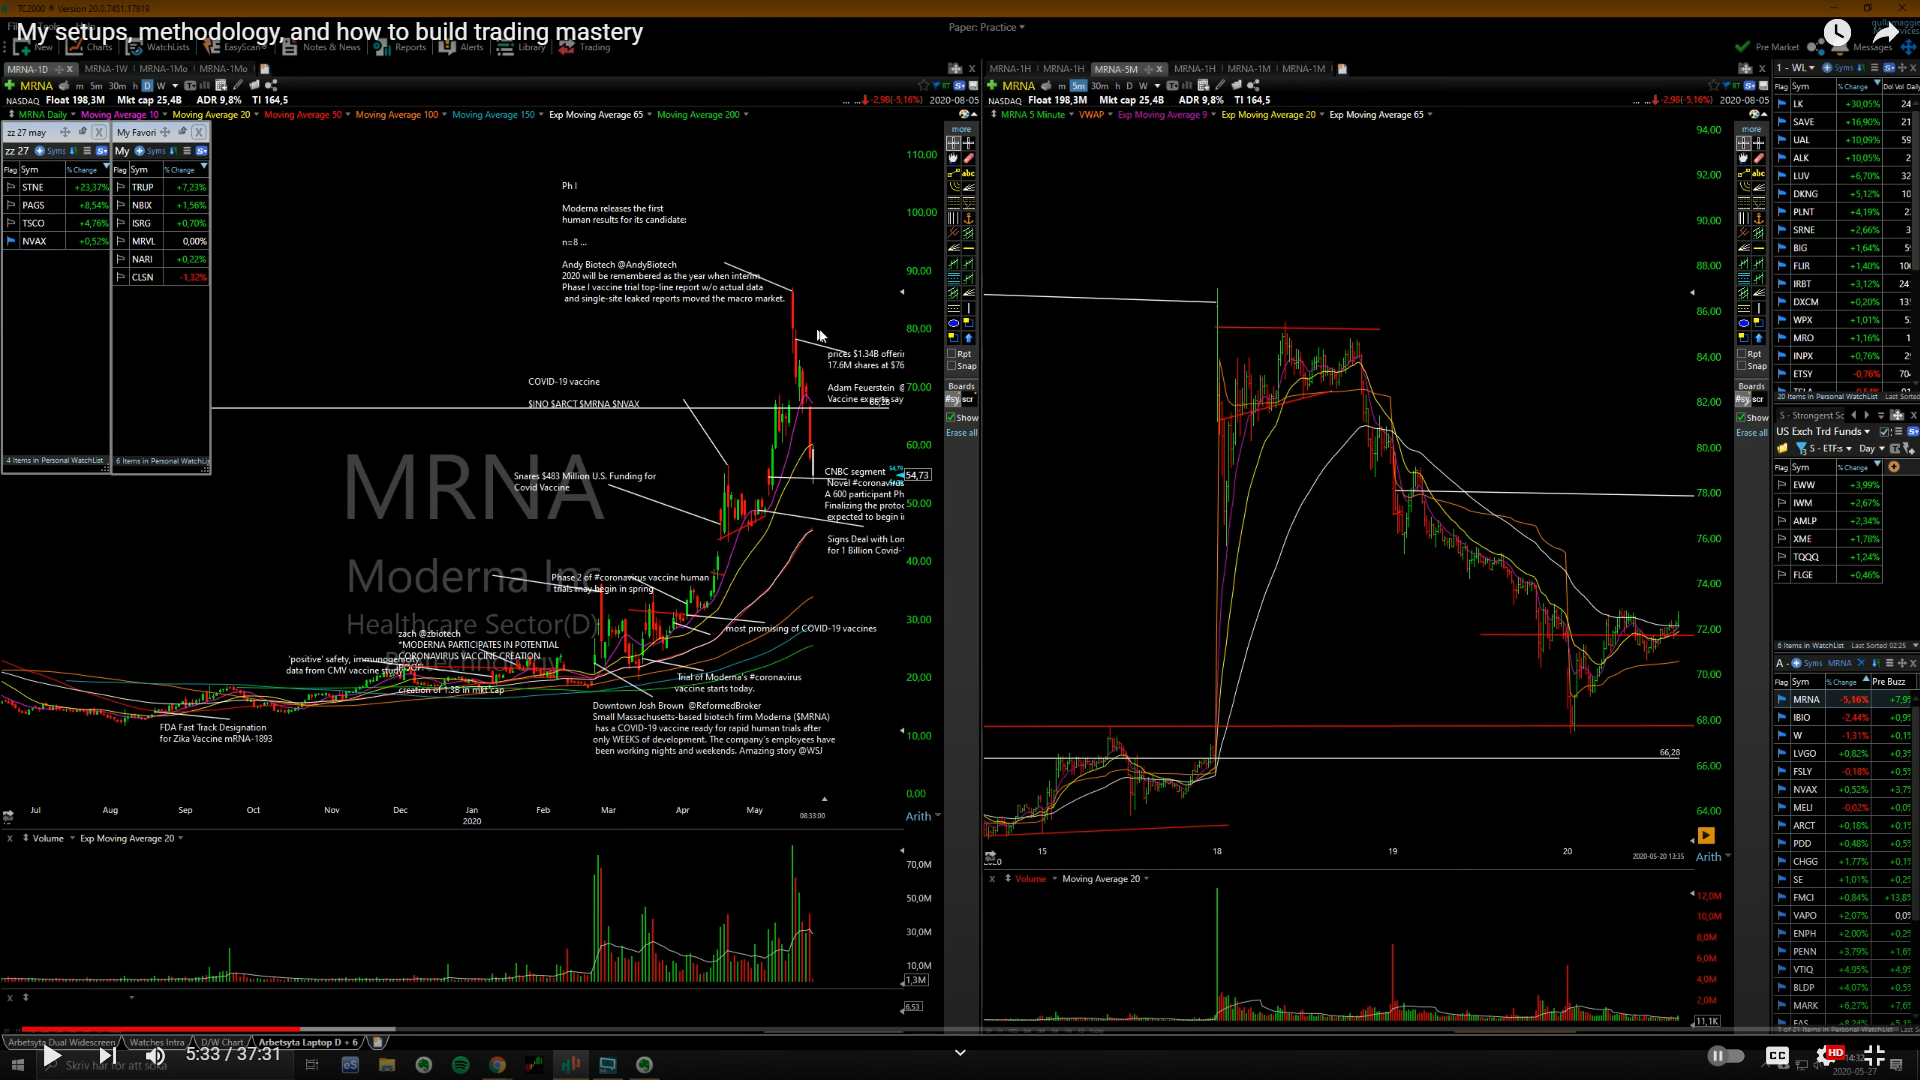 So this one I was stalking for a good r/r setup. It went in a tight tight range, then late day started failing. Tight range, risk $2 to make potentially $20 to the downside, that’s exactly what happened, just straight down from there. This was another extended stock, but it wasn’t up 3/4 days in a row, it had just been flagging for a week, and then it gapped up on this news, but it was already pretty overextended.
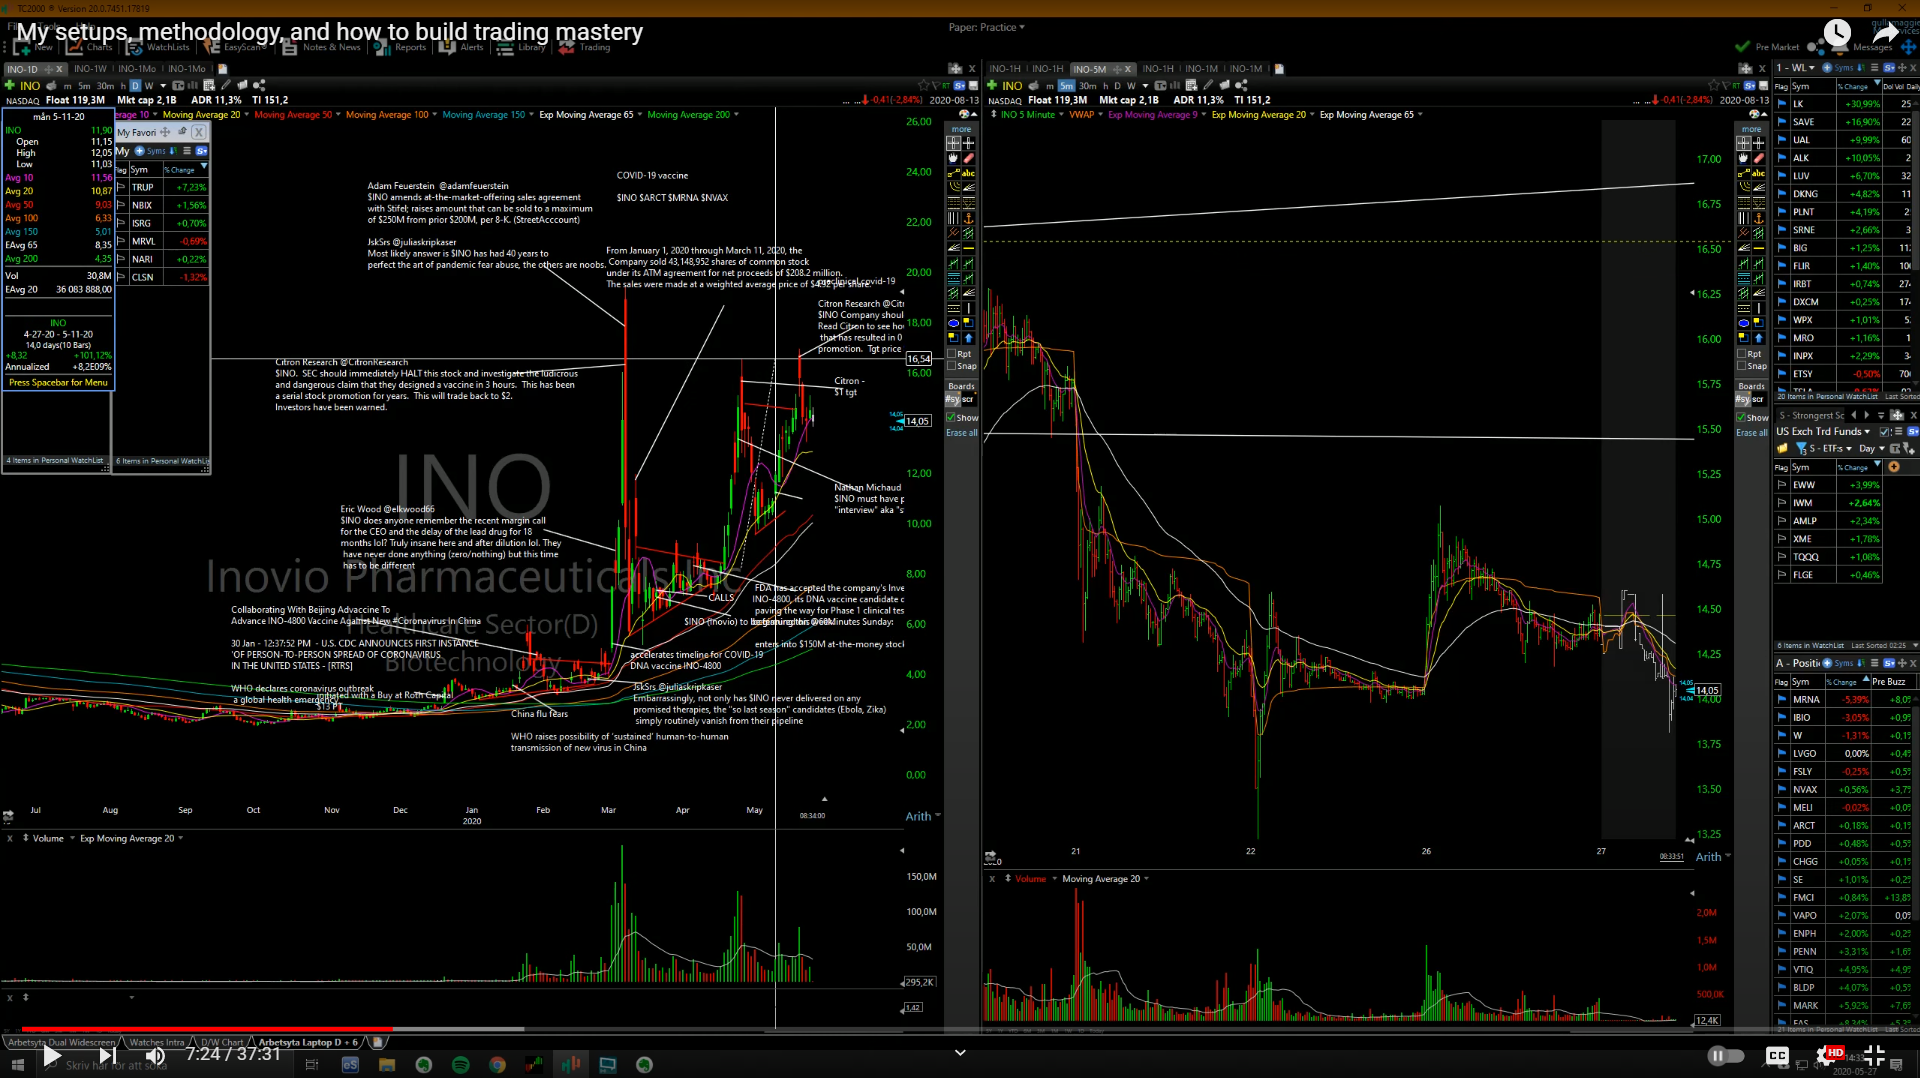 And it’s this same thing, orls is the key. So you wait for orls, stock has been straight up, then it triggers, tries to bounce.
 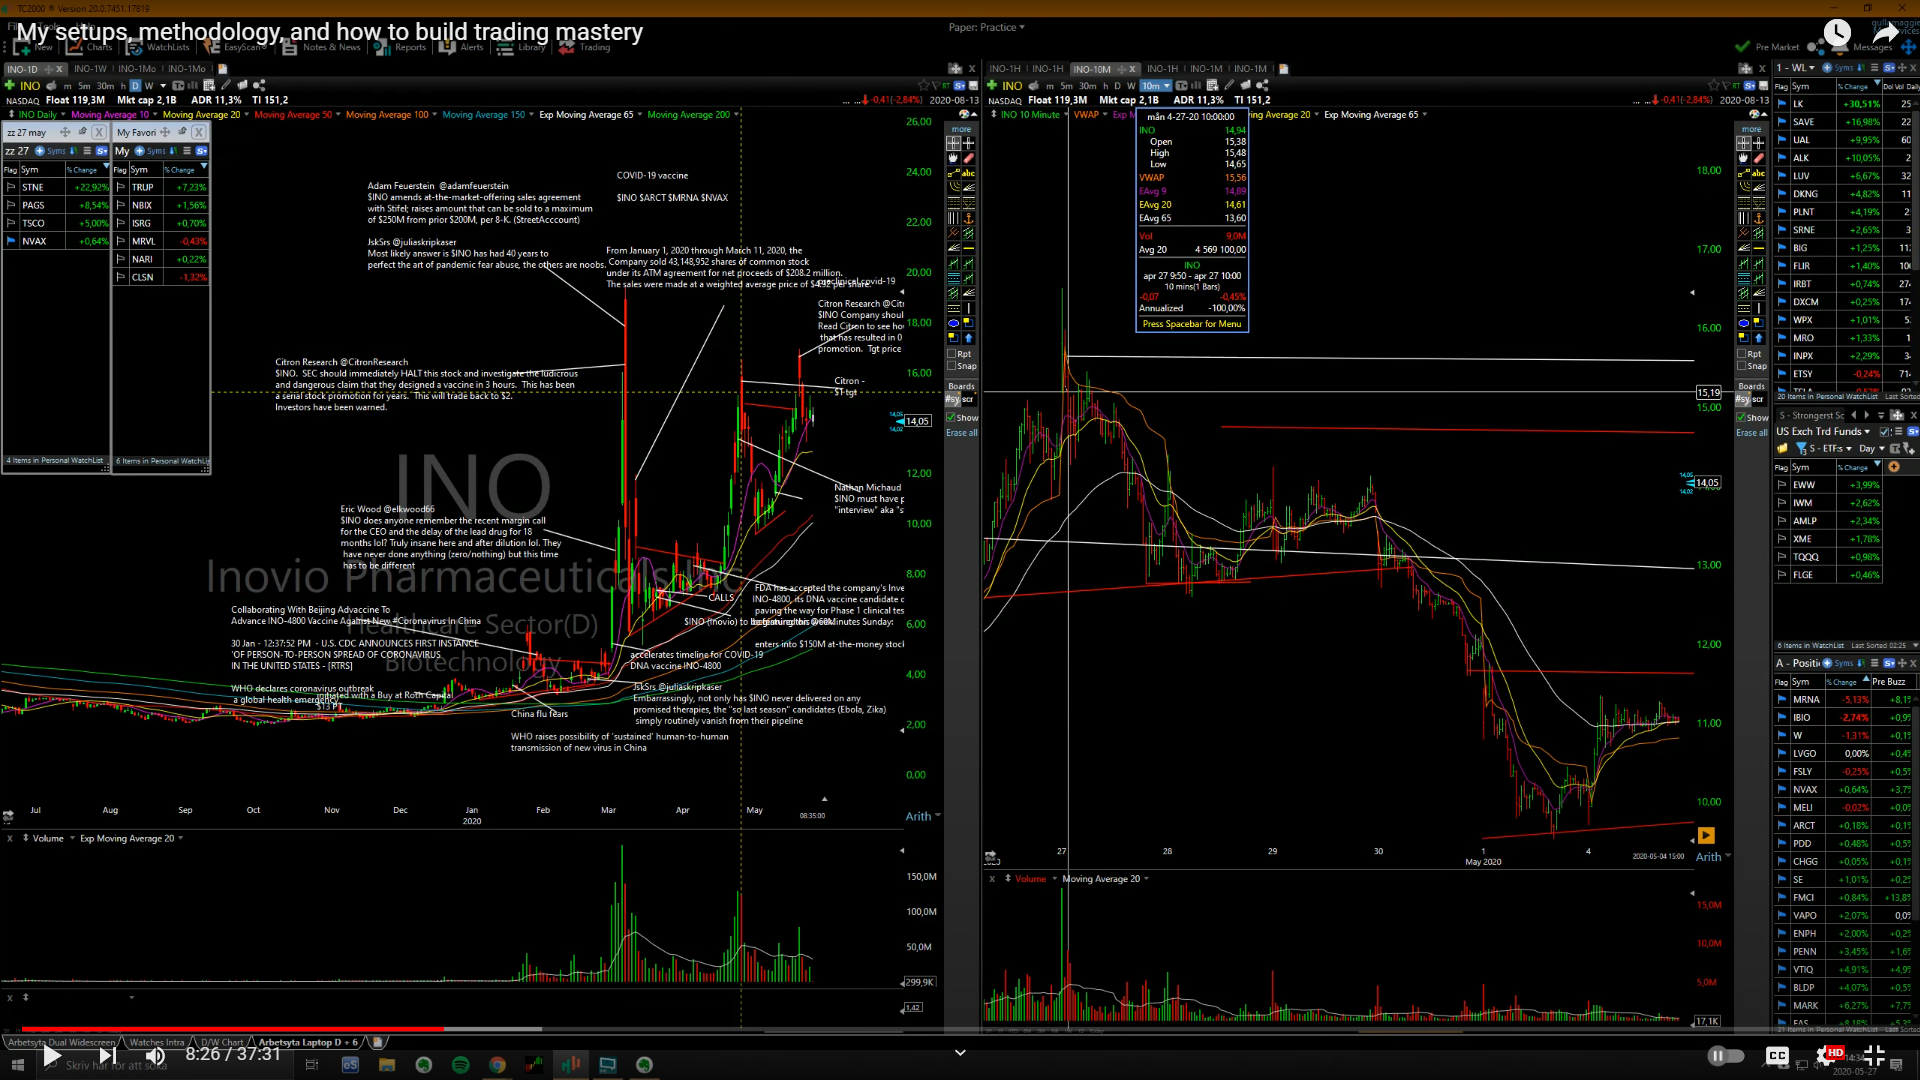 I’m gonna introduce you to another indicator vwap. I only use this when I’m shorting stocks pretty much, or when I play mean reversion trades on the long side, only when I do bounce plays. So it tests vwap, can’t get above, holds below vwap, midday, built a range for several hours, then it breaks below that, then it just fades straight down.
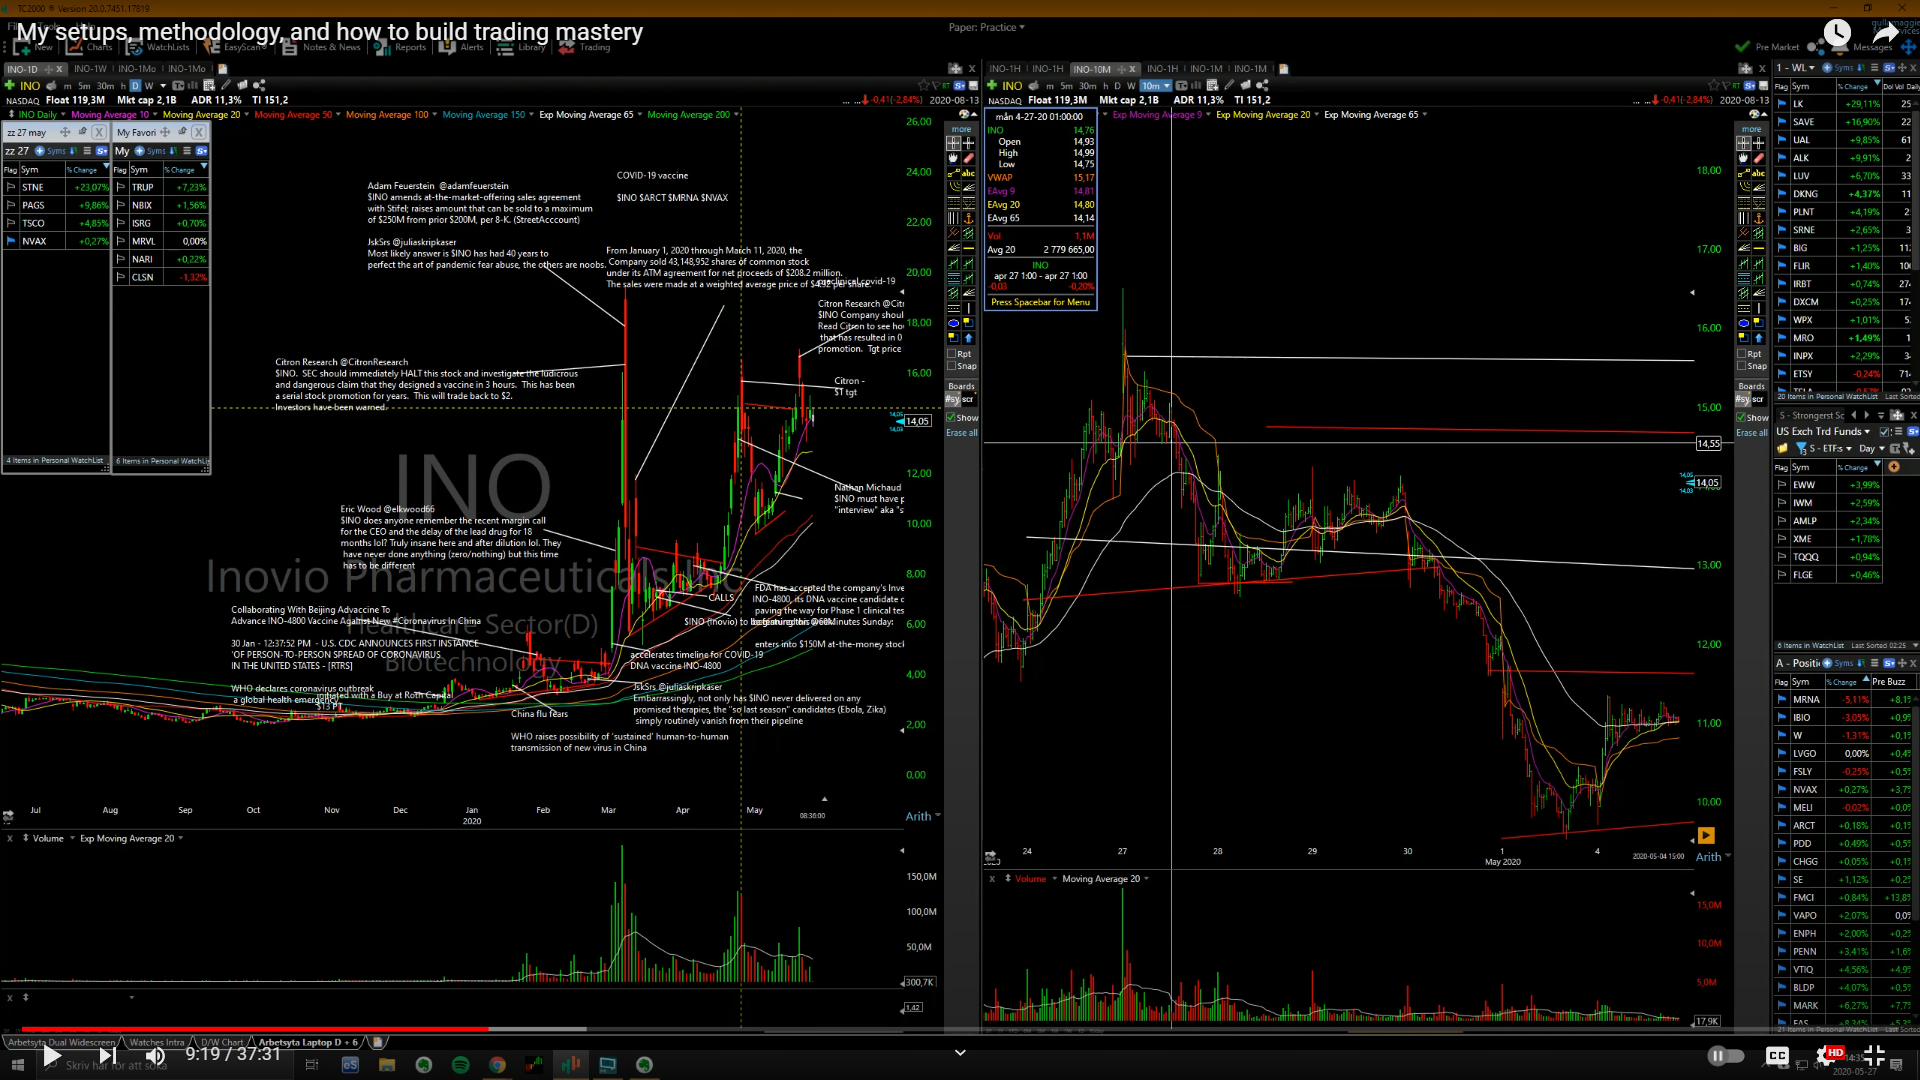
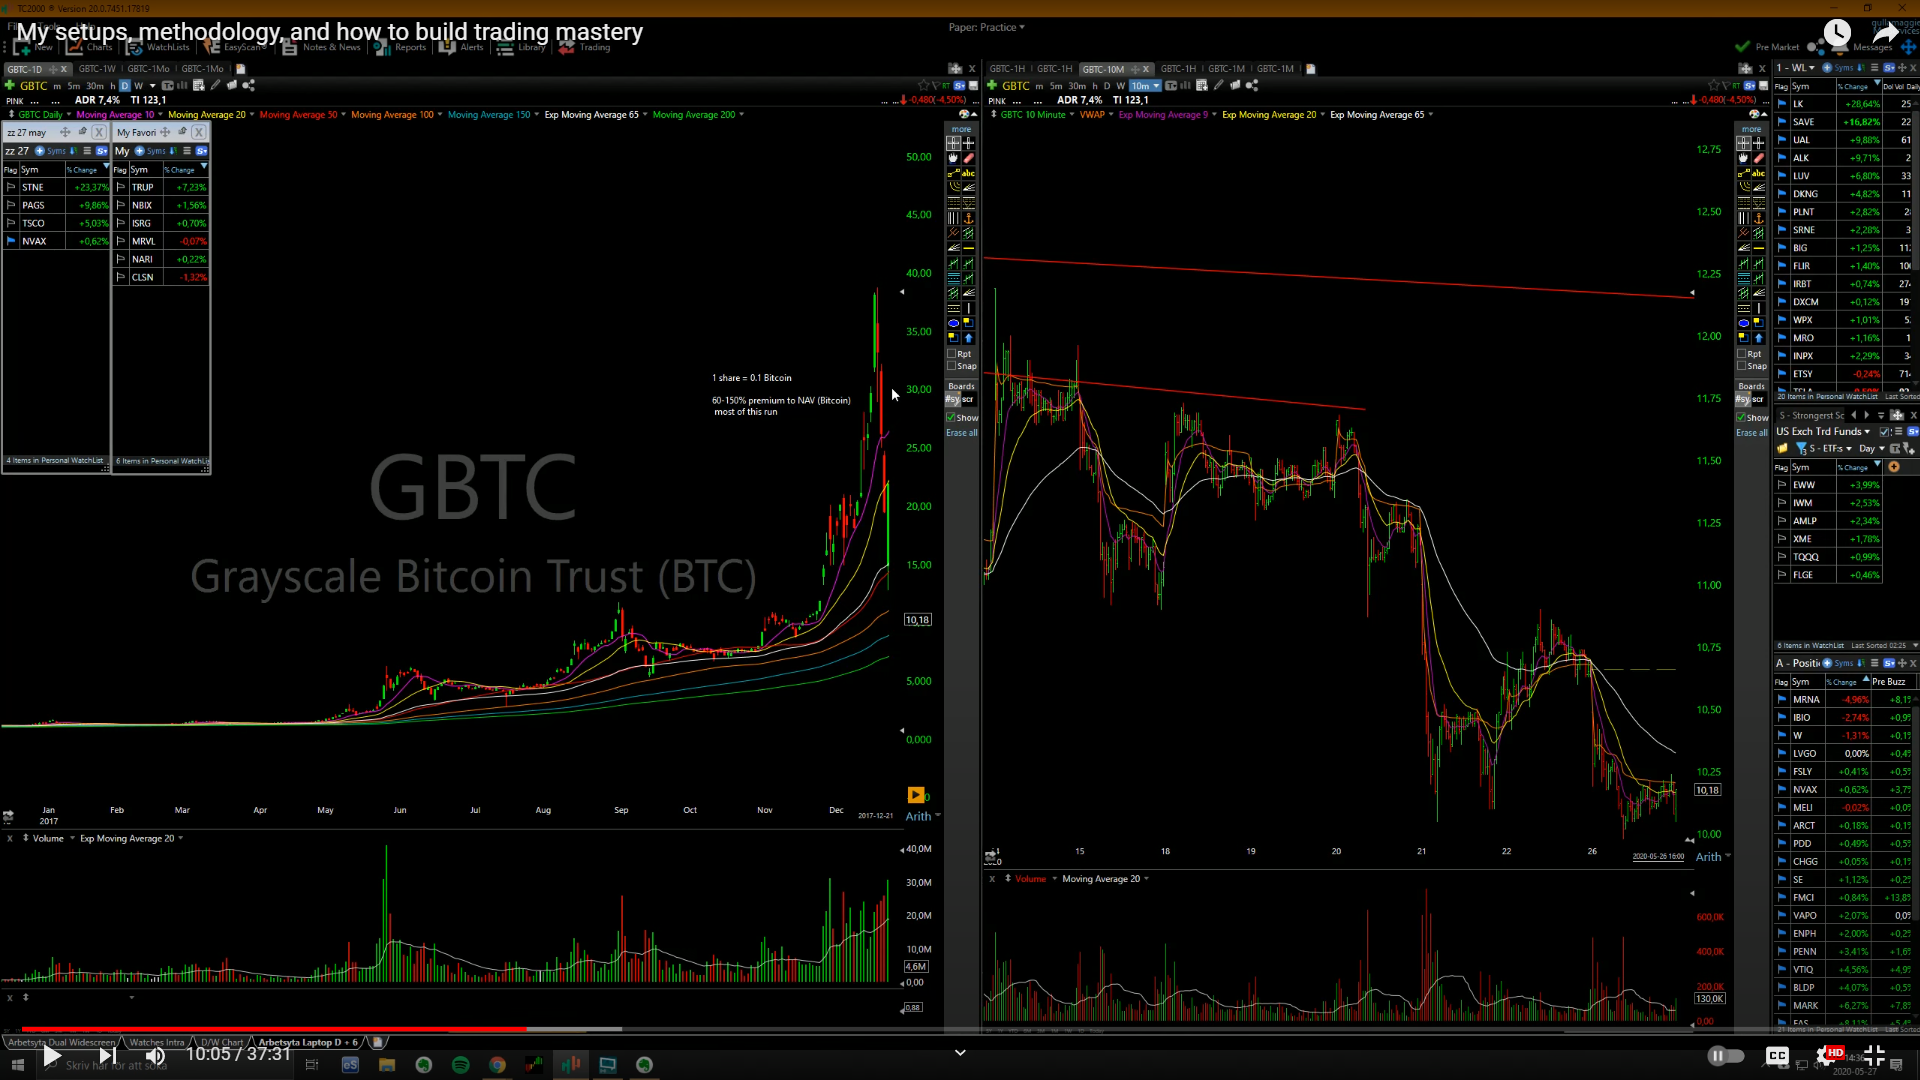 Same concept, you have a stock that’s down 40/50/60% in this case 70% in 4 sessions. 4th day, gaps down big, has a wash out, goes a bit lower from the open, then it’s the same thing. Reclaims vwap, holds above, puts in orhs, that’s when you go long, when it starts proving itself. Then it bounced, the high here was 110% in 2 days. You want to find these stocks with big big ranges, that’s where the big money is.
 A lot of stocks they start fading mid/late day, these momo stocks, that’s where you have a set r/r, you don’t have to guess where the top is gonna be, then it faded 70% in 4/5 days. Now this day here is the bounce, so it’s like you flipped the chart, same trade but on the long side. It’s extended to the downside, puts in the first green candle. This is something I talk about, the first green or first red candle, if you have something going straight up or down, in this case you wait for the first green 5min candle before you buy, then you can use the low of that candle as your stop. So takes out that candle, add a little bit, takes out orhs, add some more, then it goes straight up, then the next day it went up another 20/30%.
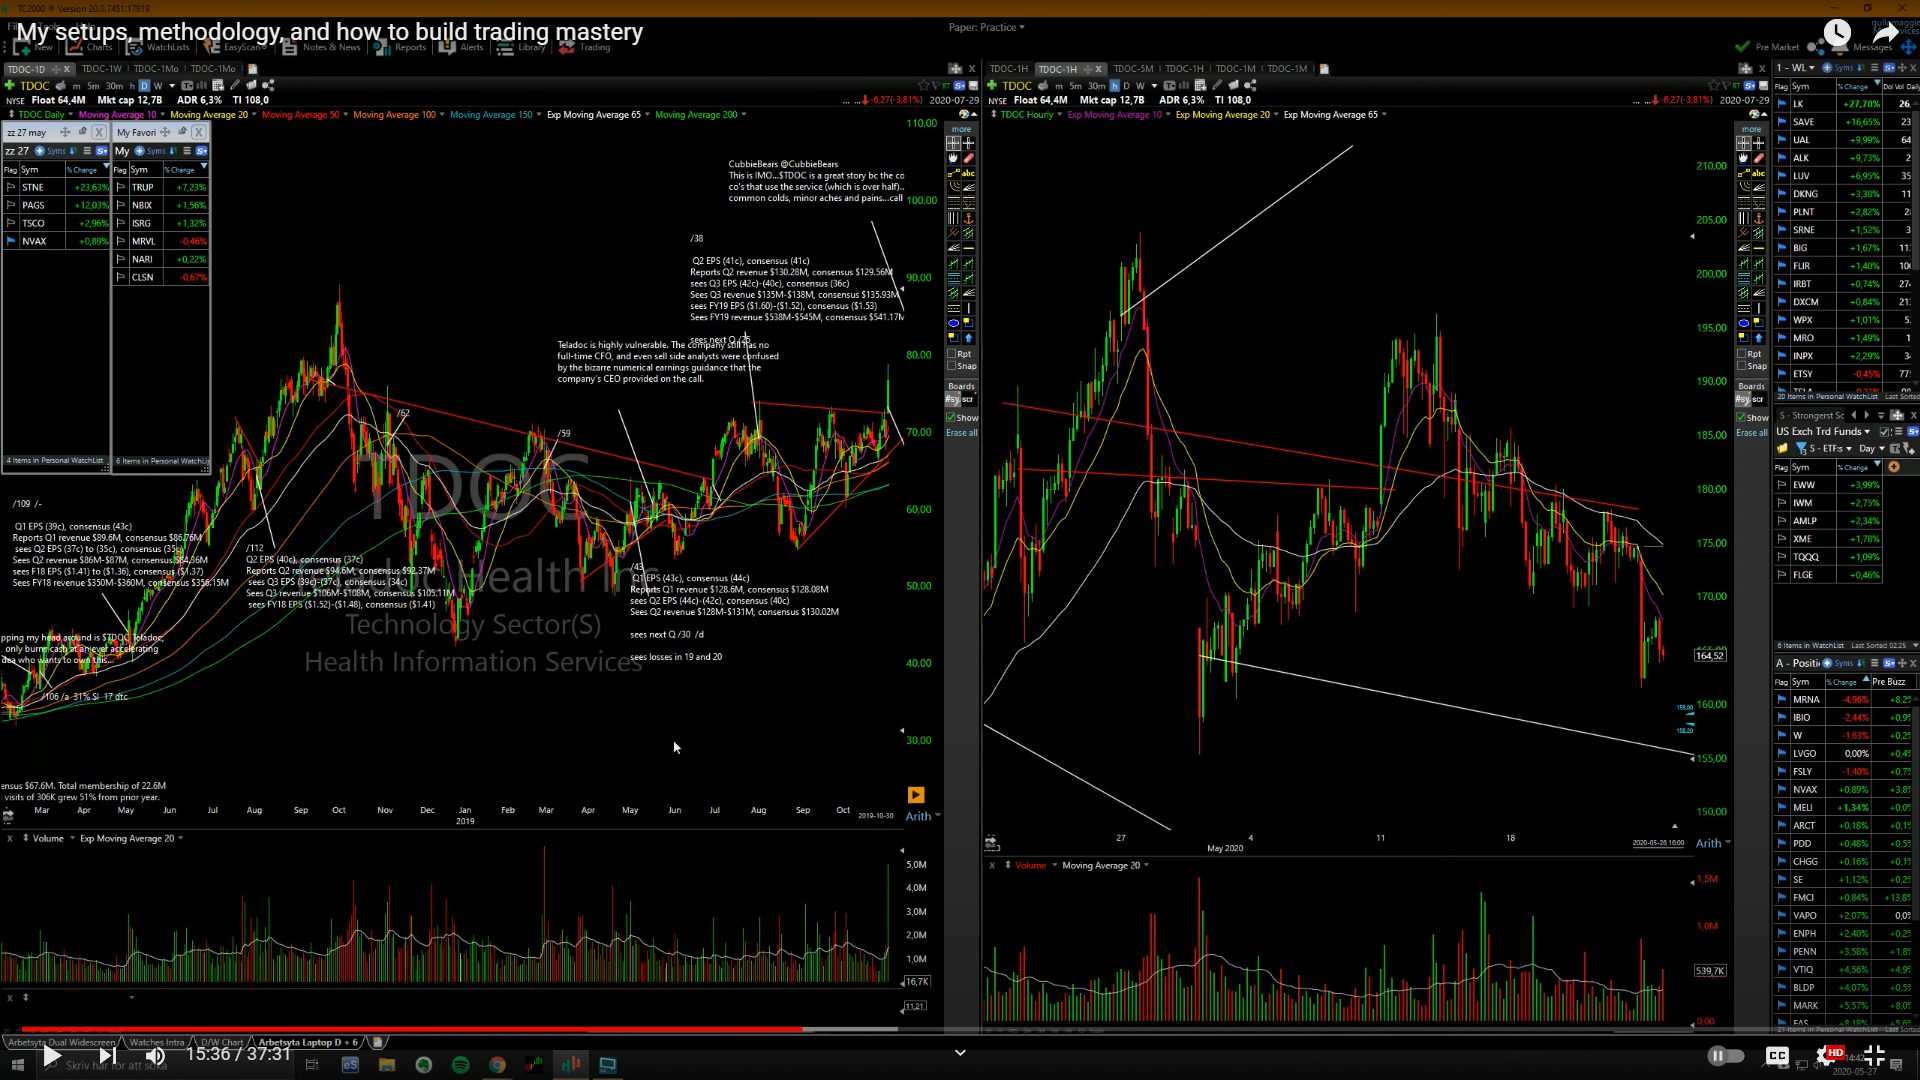 Look on the weekly chart, building hls for a over a year, took out a range, this is a growth stock, right sector, right business, things are going well, this is why the stock is straight up since 2016. Then they gap up on a big earnings report, this is what started the big move, went up 160% in a few months.
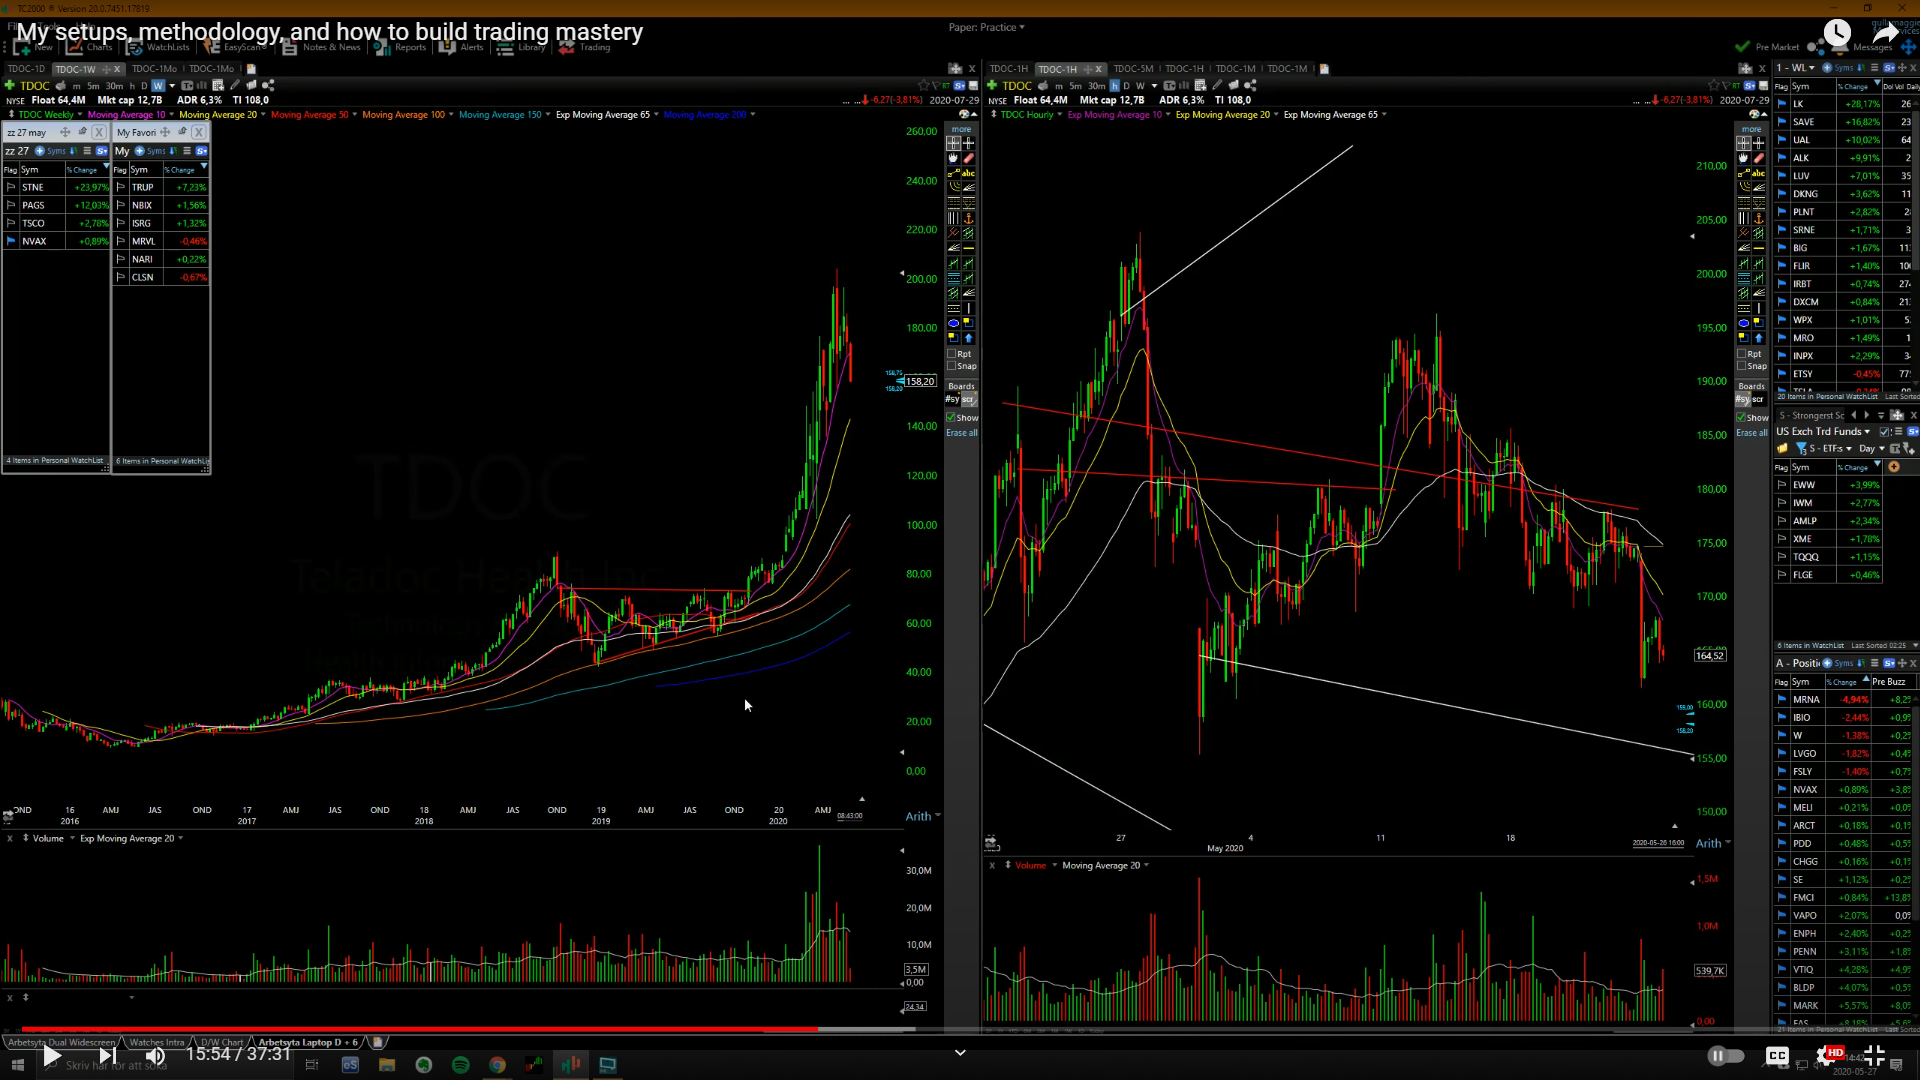
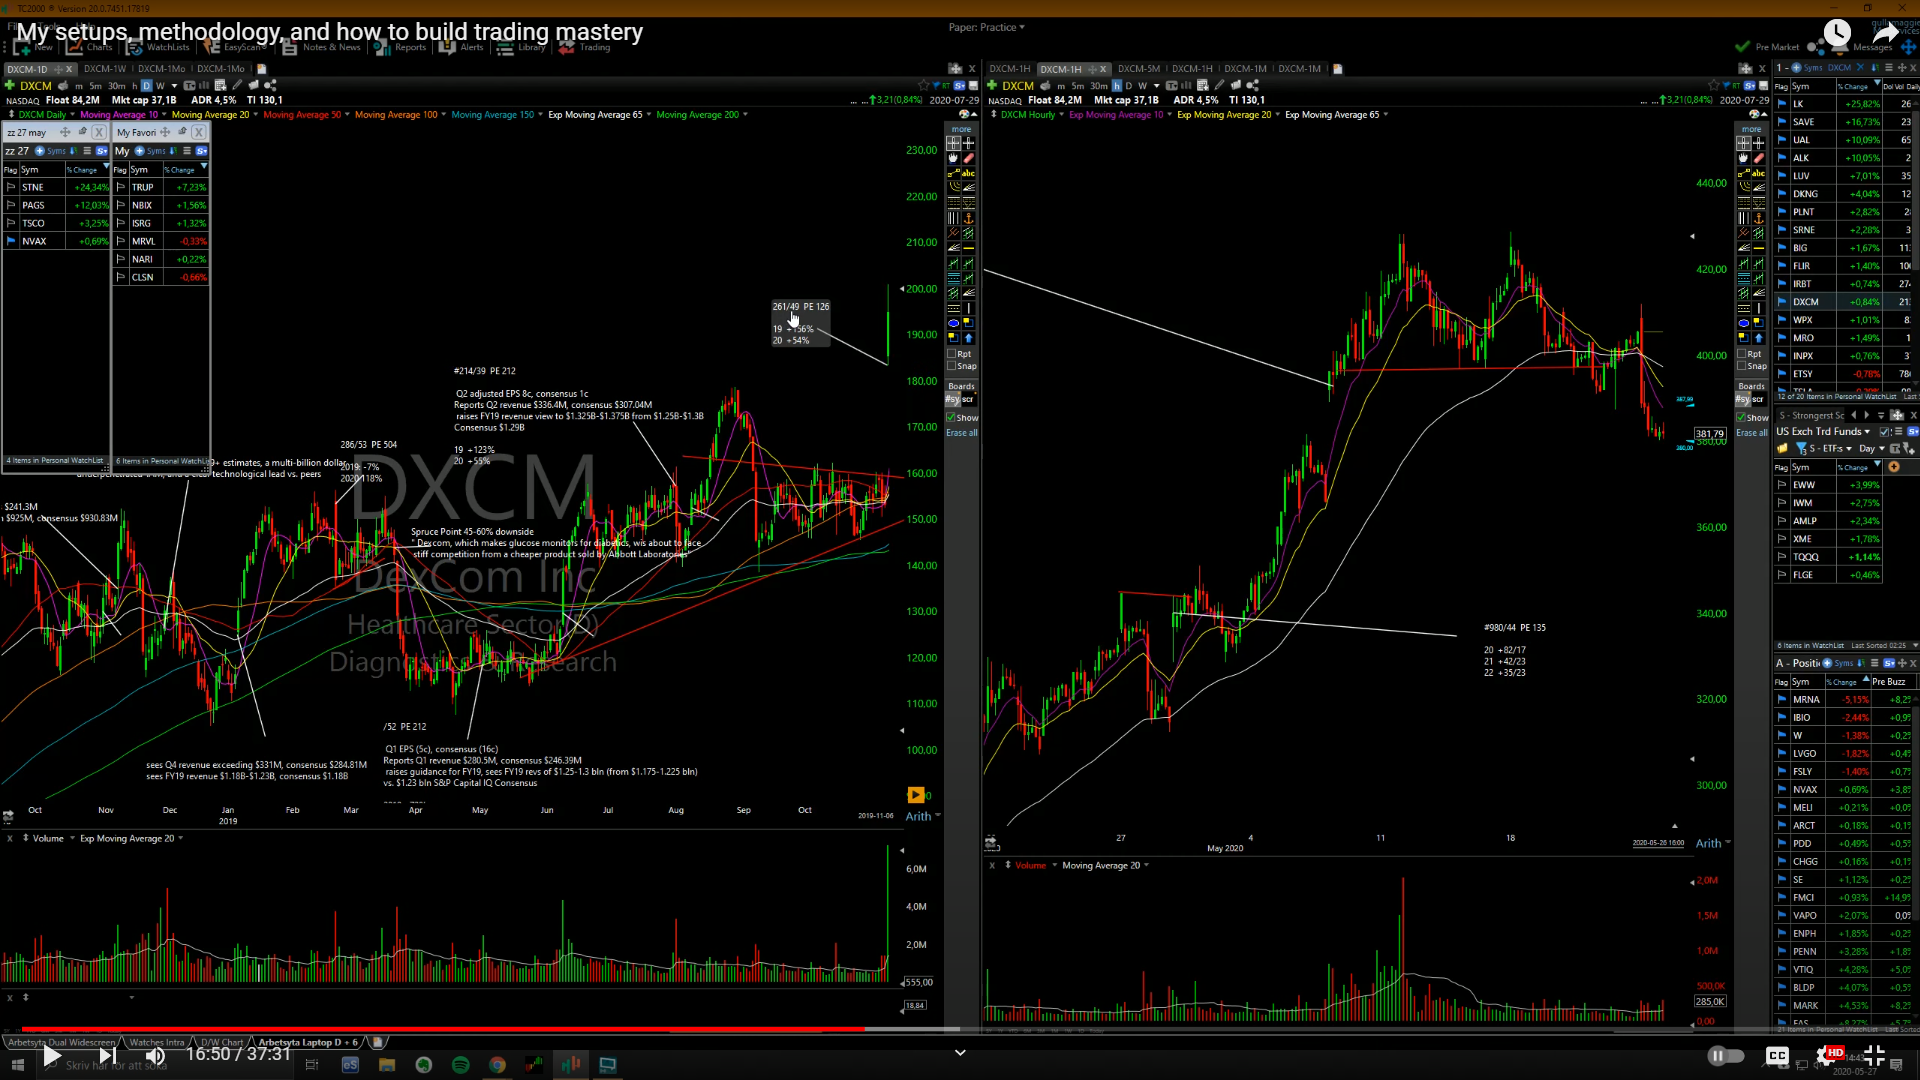 Eps grew by 261% yoy and rev grew 49%, this is a growth stock. Estimates were 156% for this year and 54% for next year, so they were going to keep growing. And it went straight up. Higher lows for 6 months, year long range, then it gaps up on good earnings, beat estimates etc etc.
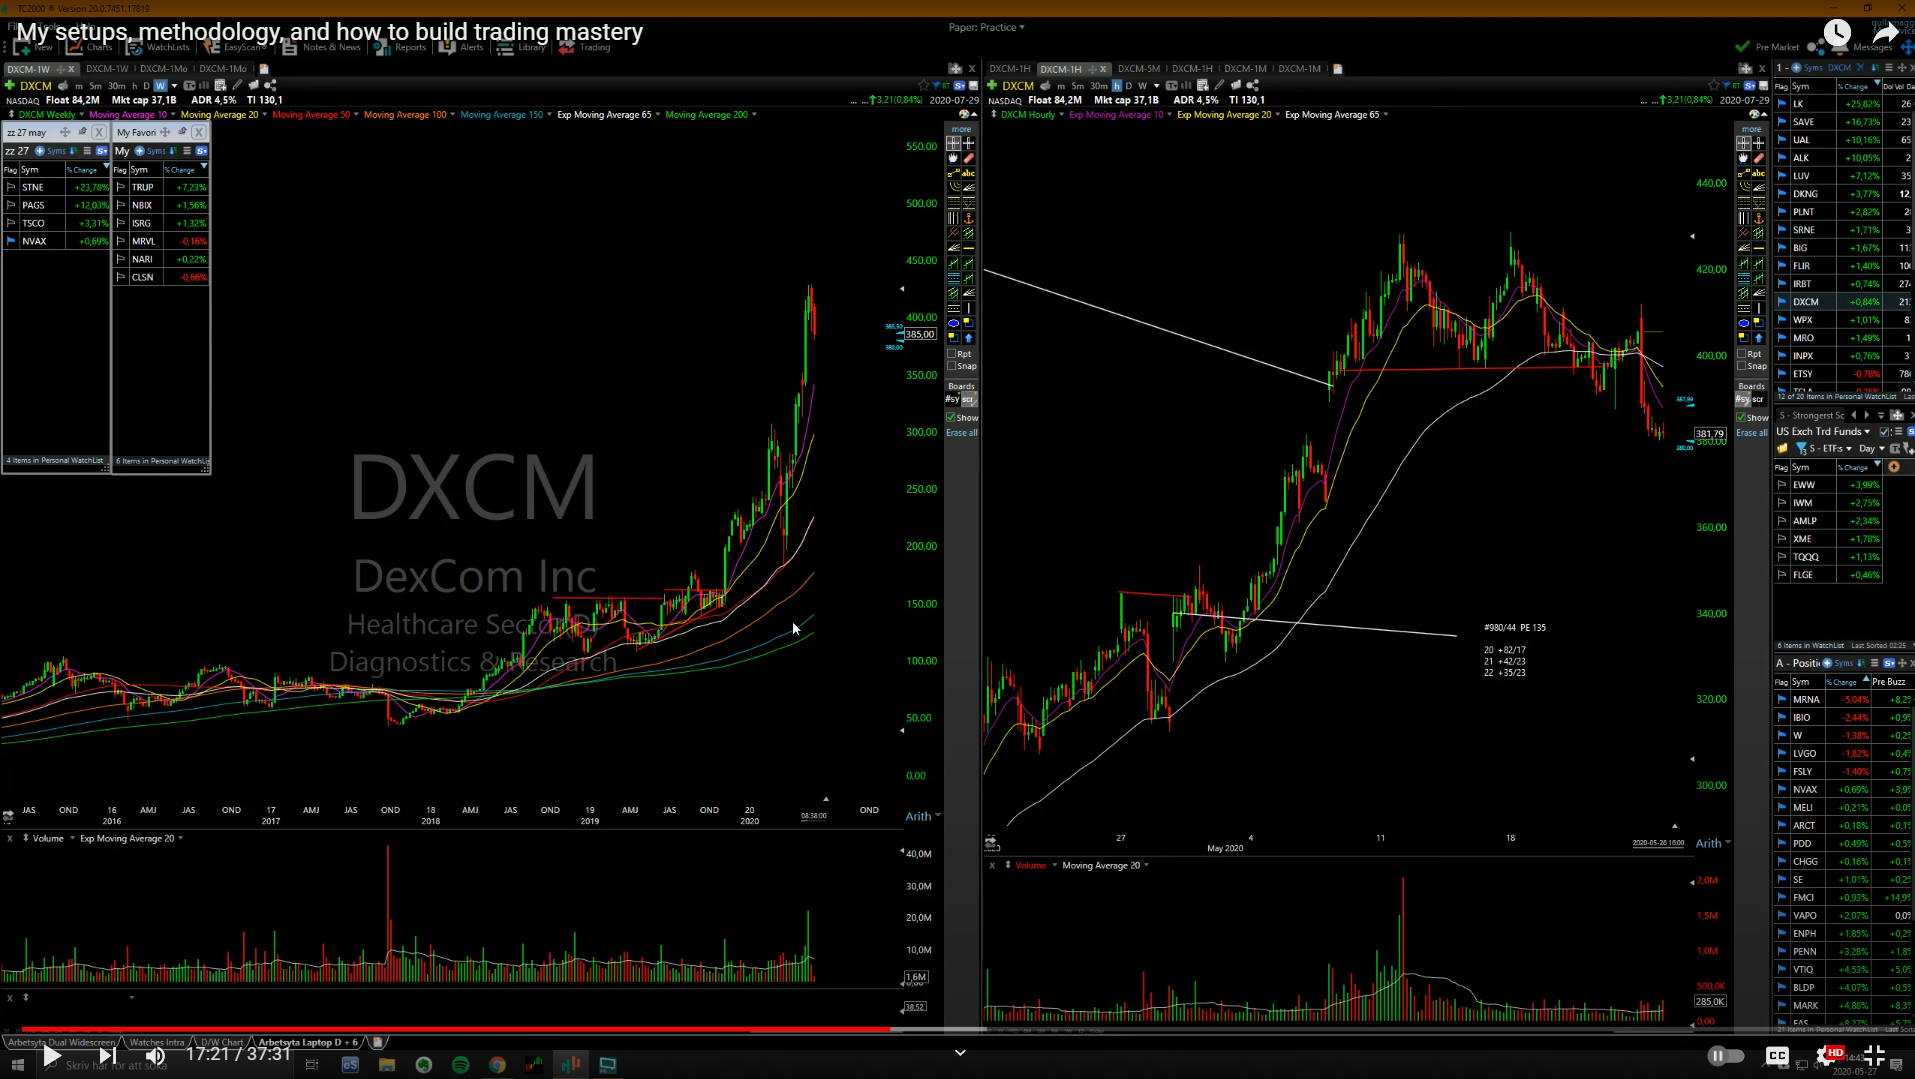
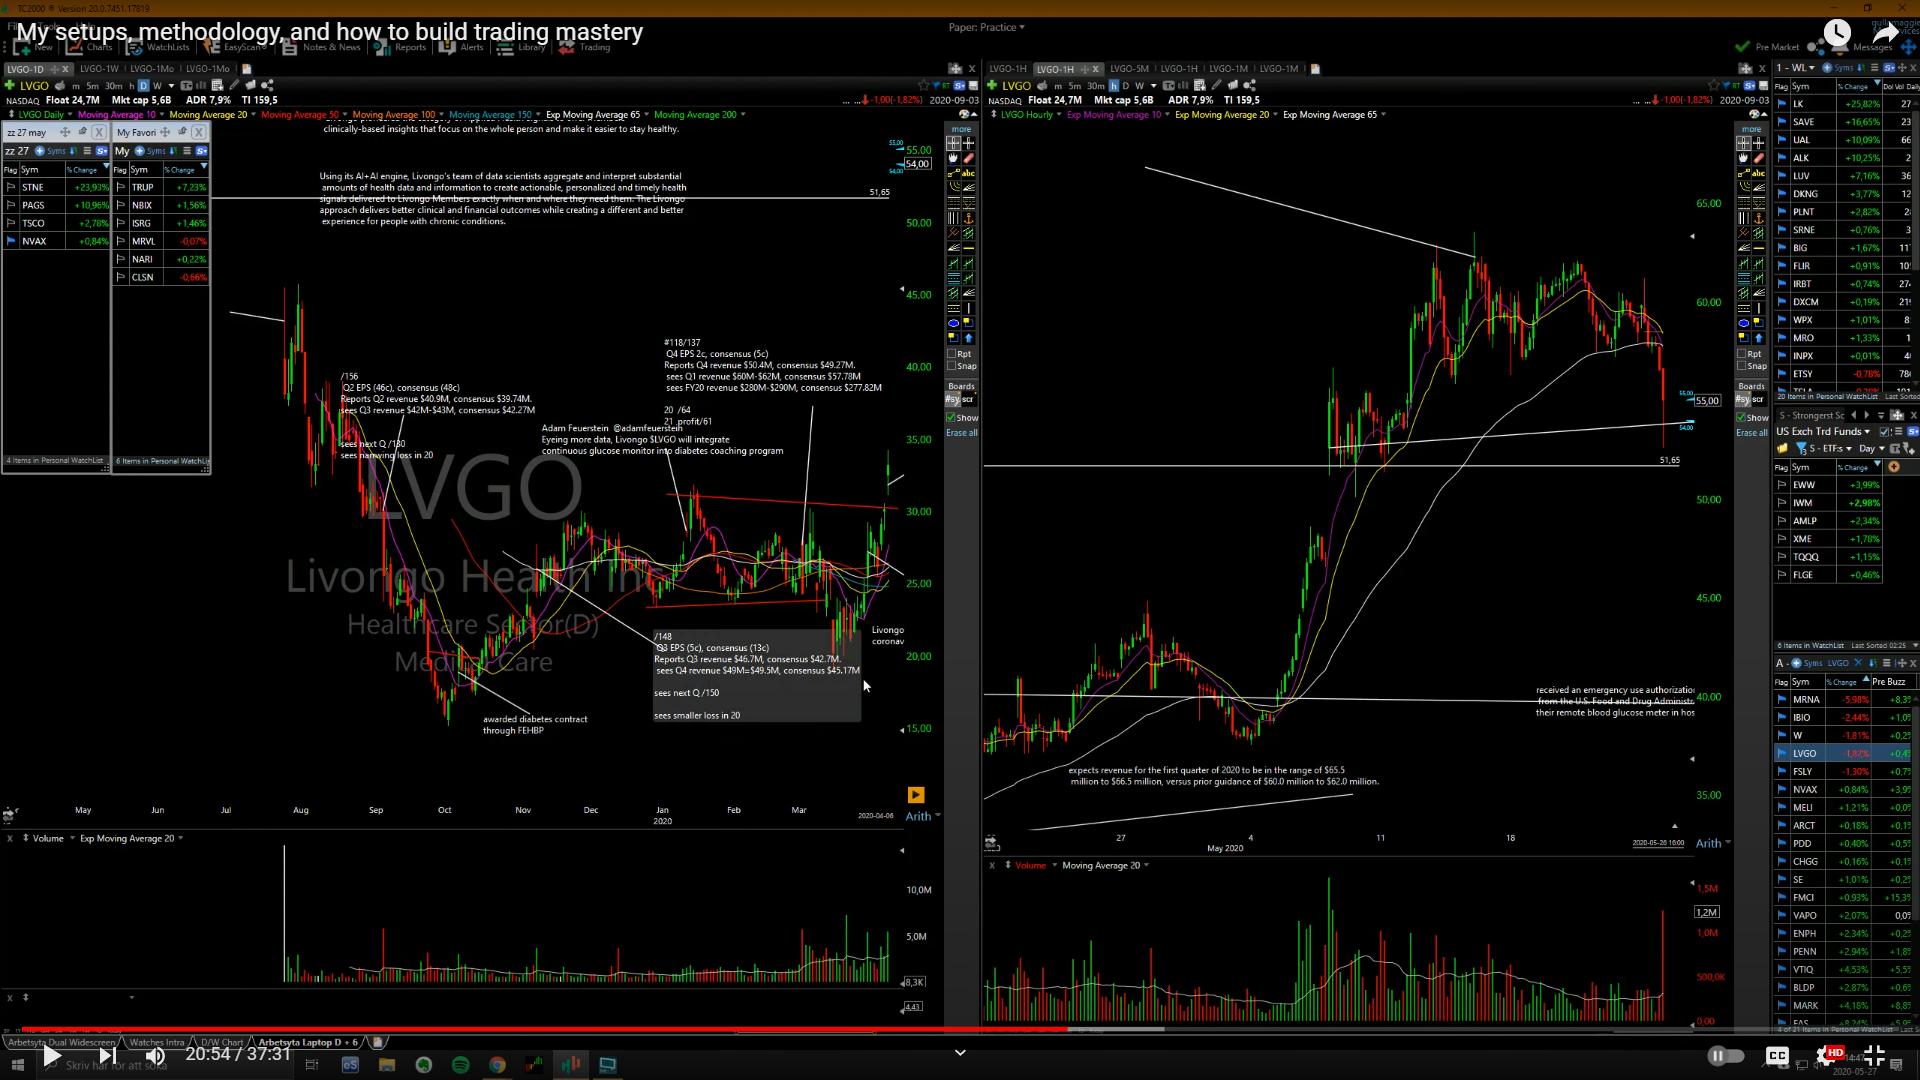 Ipo breakouts can be super powerful.
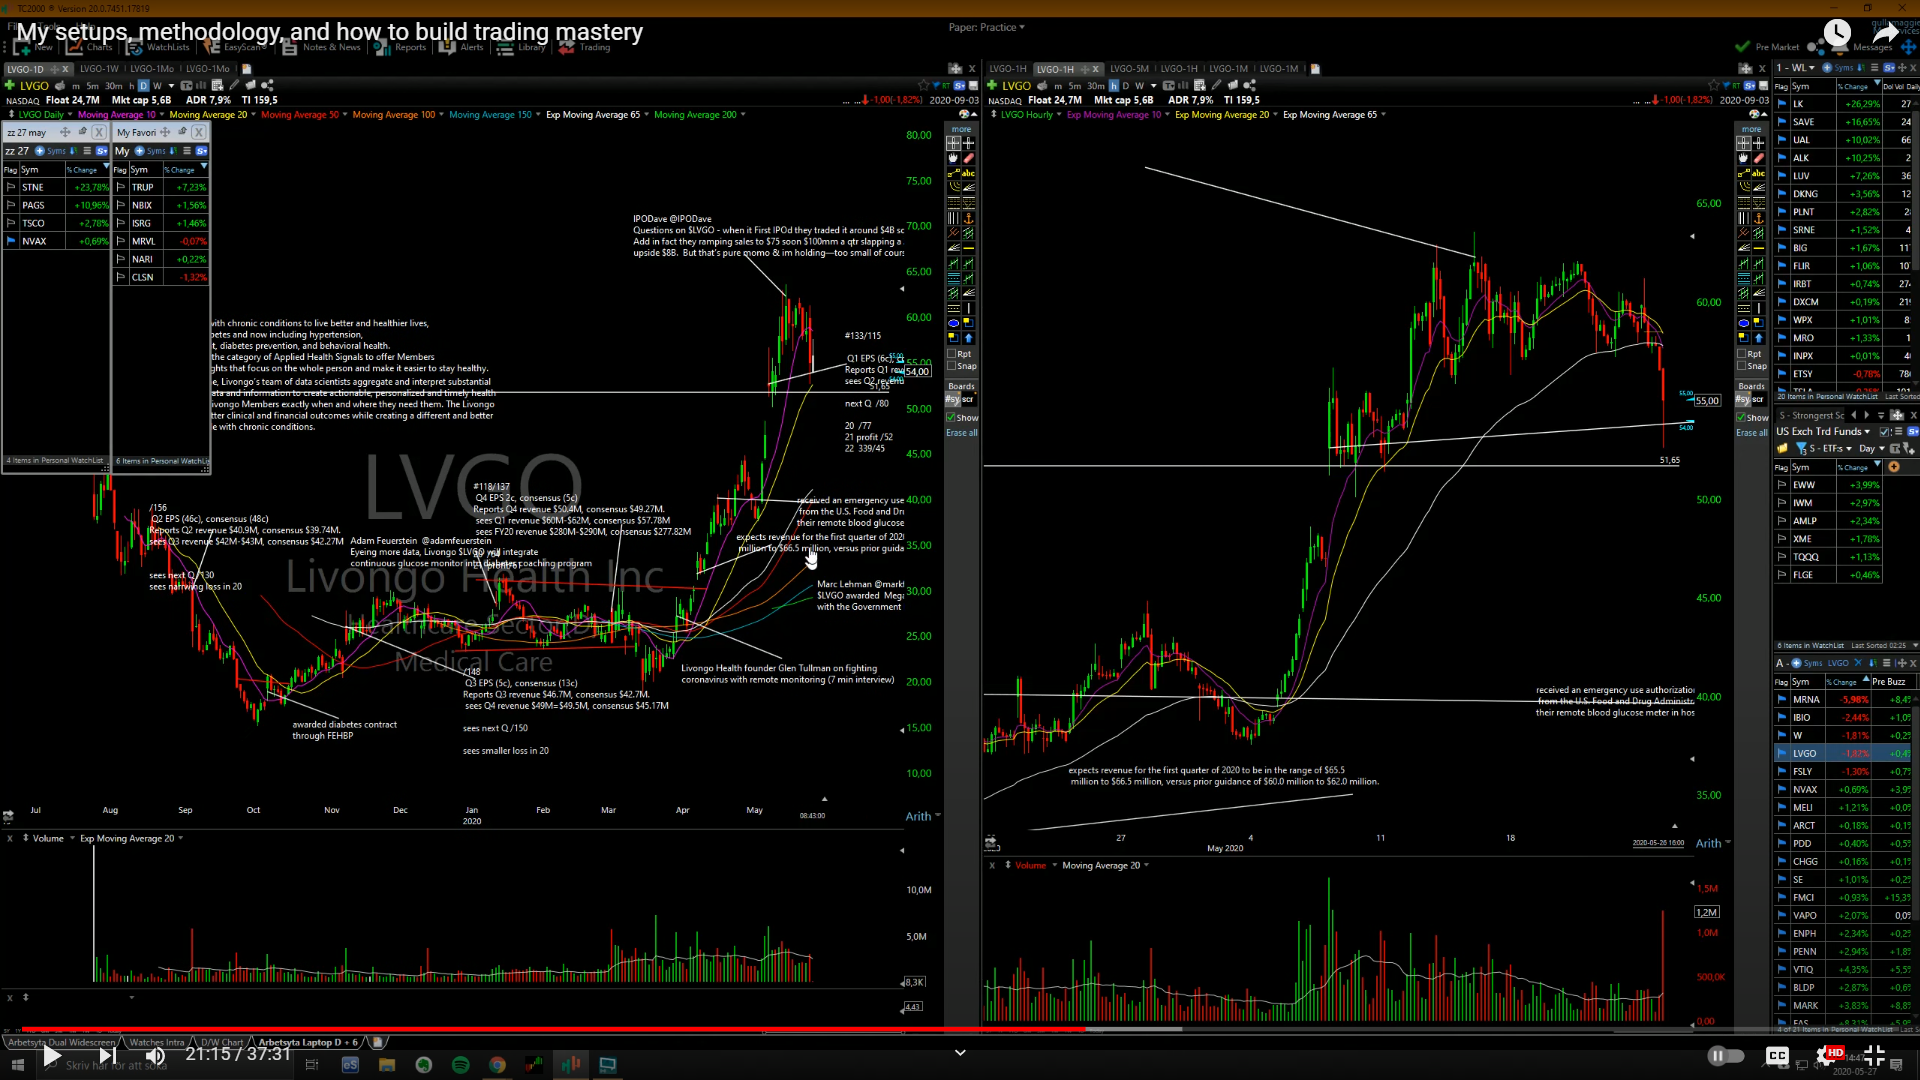
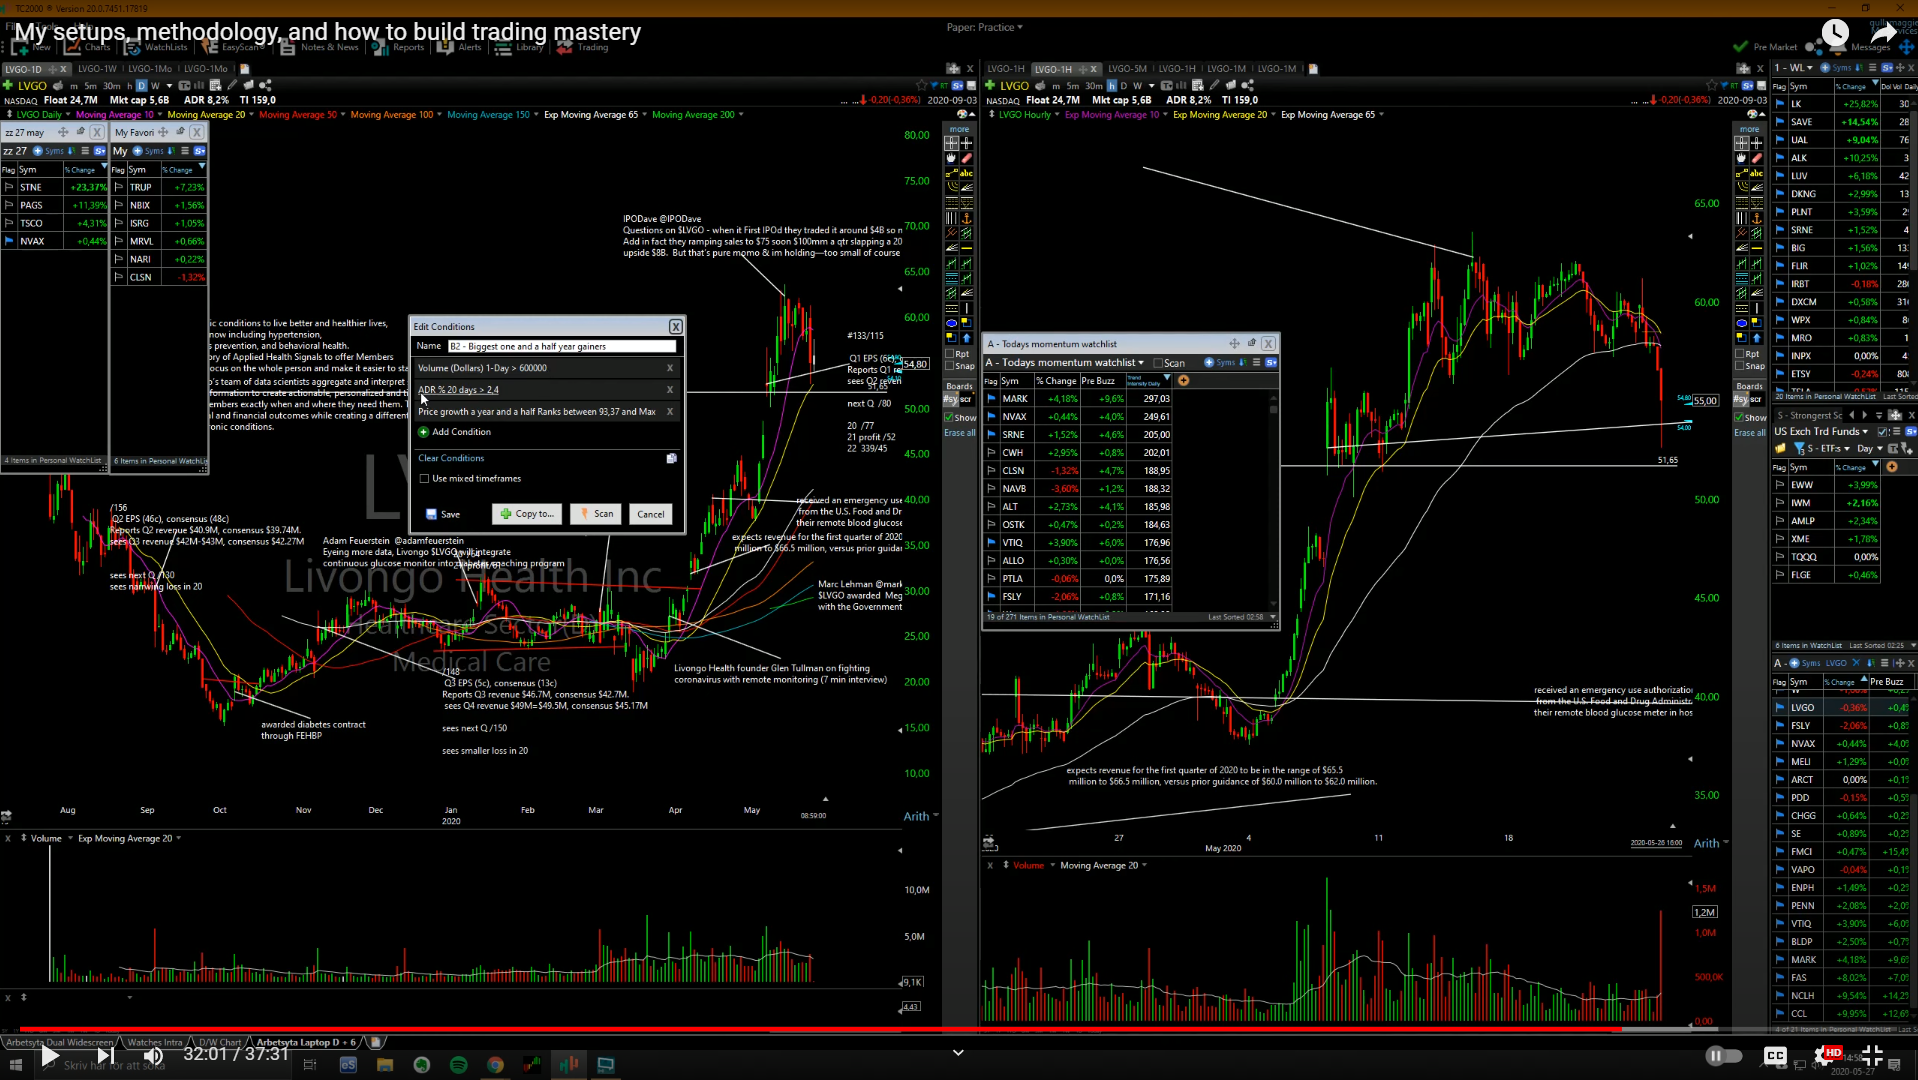 I also scan for losers, stocks down the most. Then I compile a watchlist each night, look through my scans and start stalking stuff. It’s always nice if the stocks you wanna go long showing rs and the stocks you wanna go short are showing rw.
 You have to train your brain to recognise not only the stock patterns but also the news, and how they move in relation to each other in the market. You’ve gotta do this work yourself, no one can help you with this. This is how you build mastery. Instead of following people and begging for stock tips, you need to do the research yourself.